NOAA GFS forecast validation report
This dataset validation report plots a sample of values from the NOAA GFS forecast dataset over time and across space, comparing where possible to a previously validated reference dataset. It also reports the quantity of unavailable values and their associated timestamps. These analyses are one layer of a multi-layered dataset validation process we perform at dynamical.org and also provide users a preview of the dataset contents.
Report generation start time: 2026-07-21T20:54:38 UTC
Summary
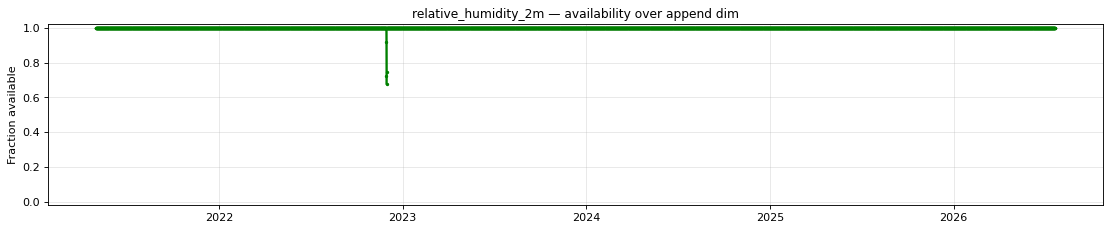
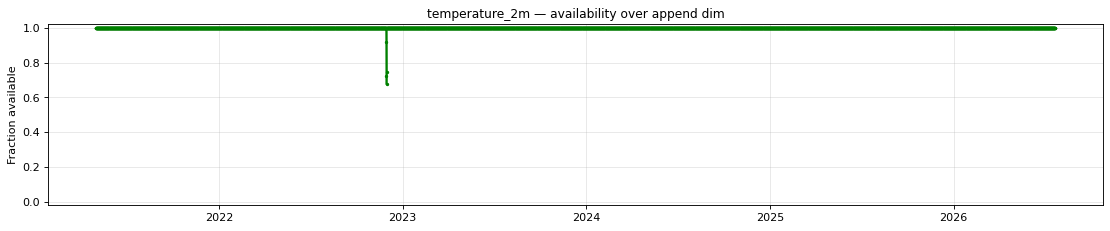
This dataset has been reviewed and is ready for use. This validation pass adds four new variables at 80 m above ground — 80 metre temperature, 80 metre pressure, and the 80 metre U and V wind components — to the previously validated set of 21 variables; all four are complete over the archive and physically consistent with the neighbouring 10 m and 100 m fields (see What looks good). One known data gap remains, unchanged from prior validation: unavailable values across four consecutive forecast init cycles on 2022-11-29 → 2022-11-30, caused by corrupted index sidecars in the upstream NOAA GFS archive (see Review notes).
What looks good
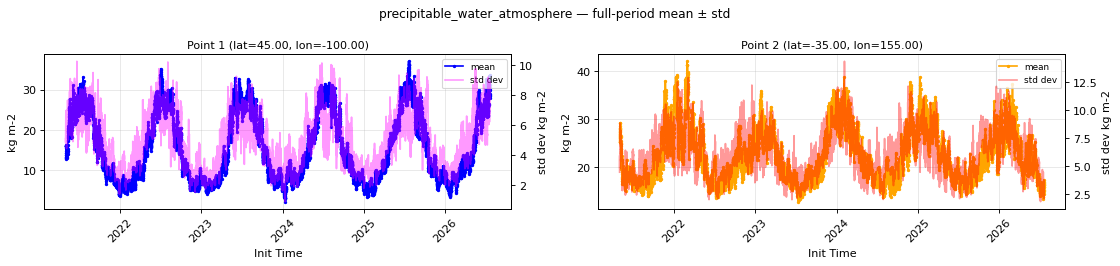
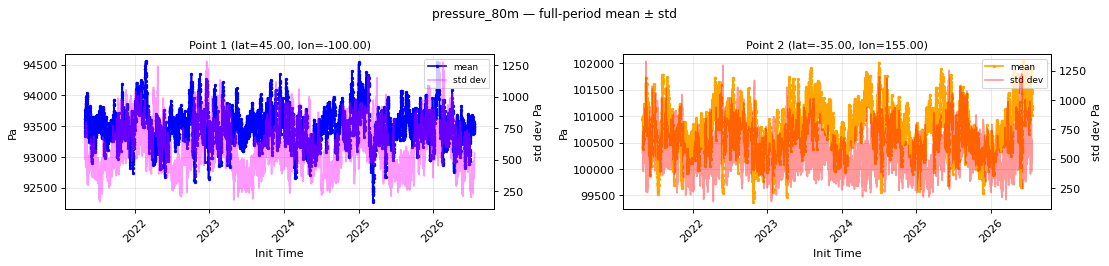
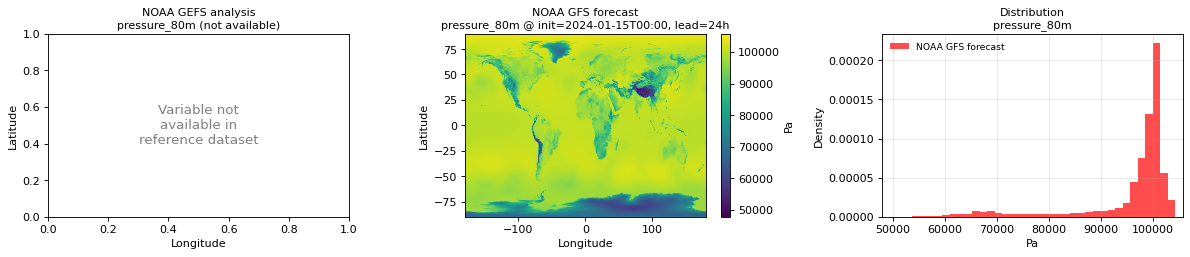
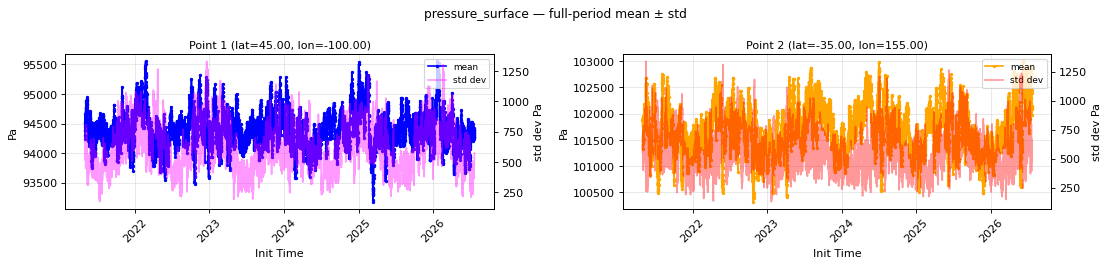
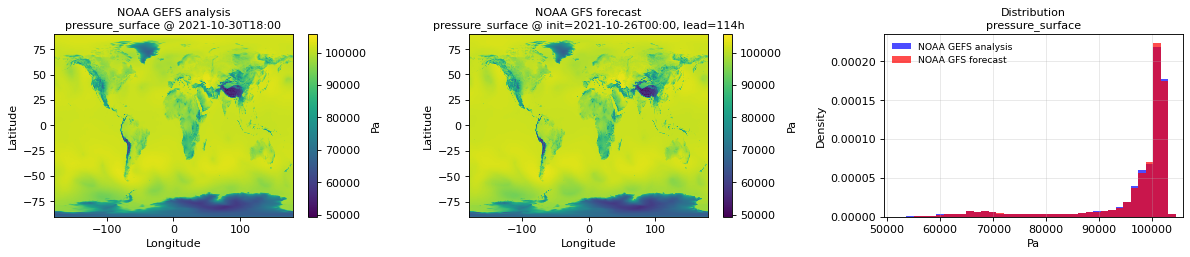
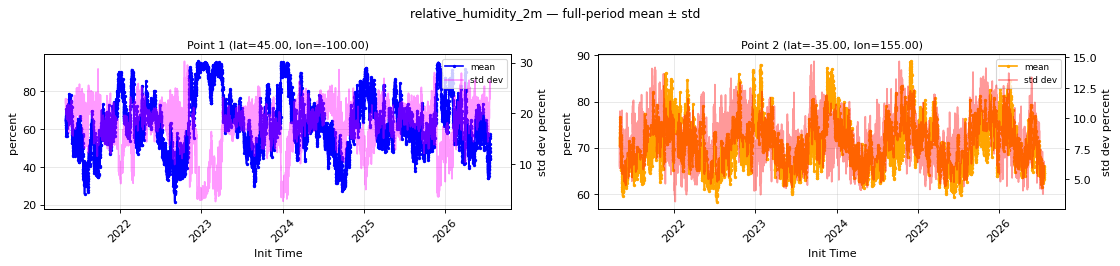
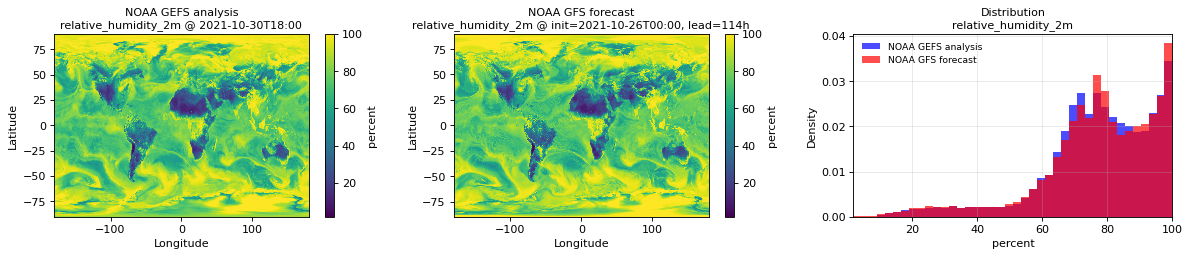
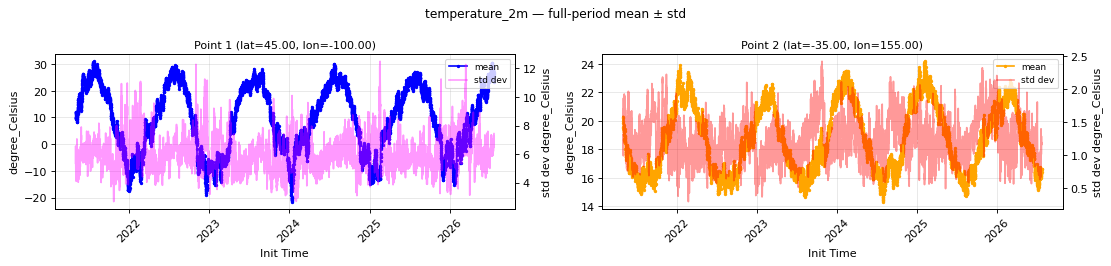
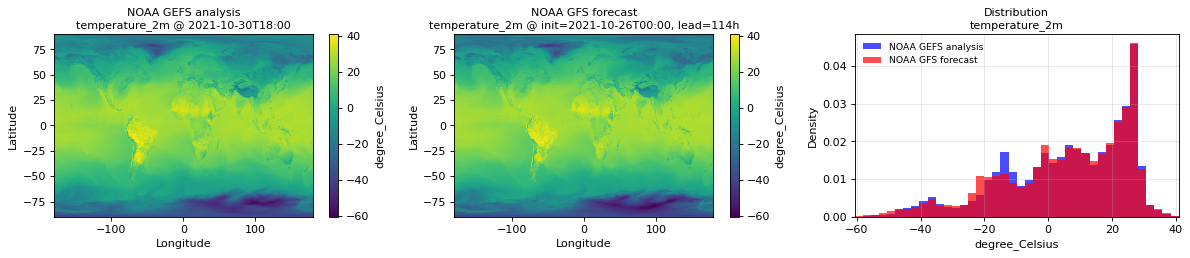
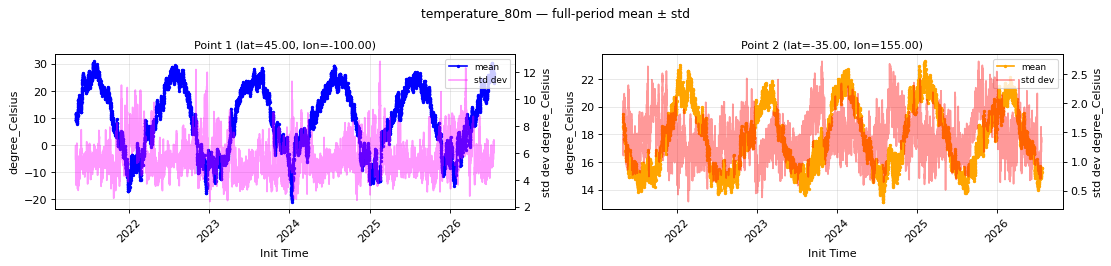
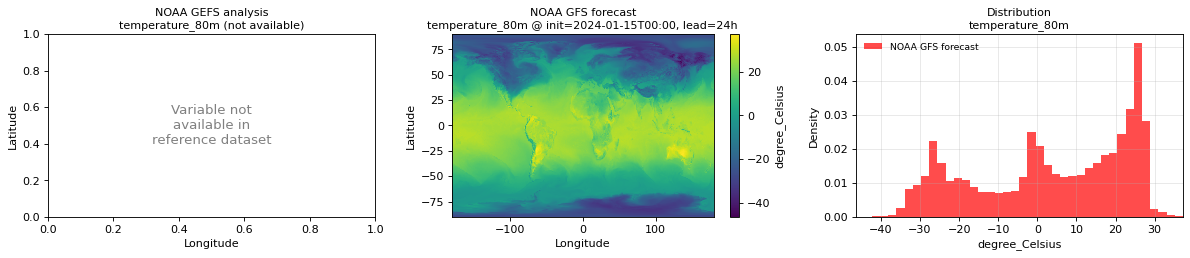
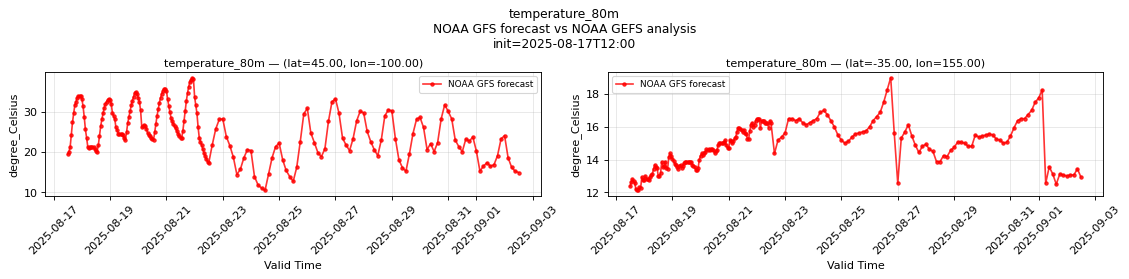
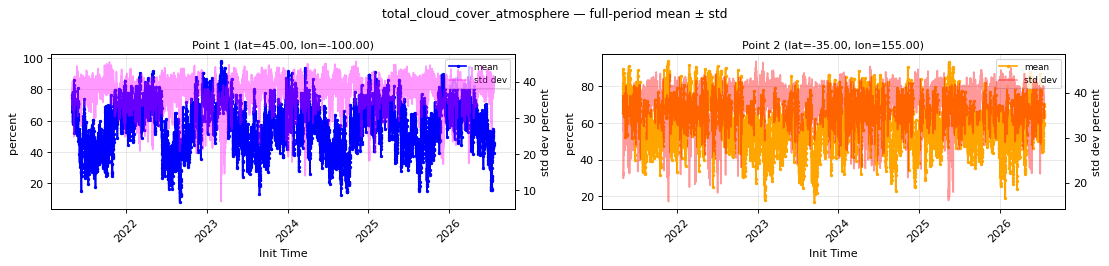
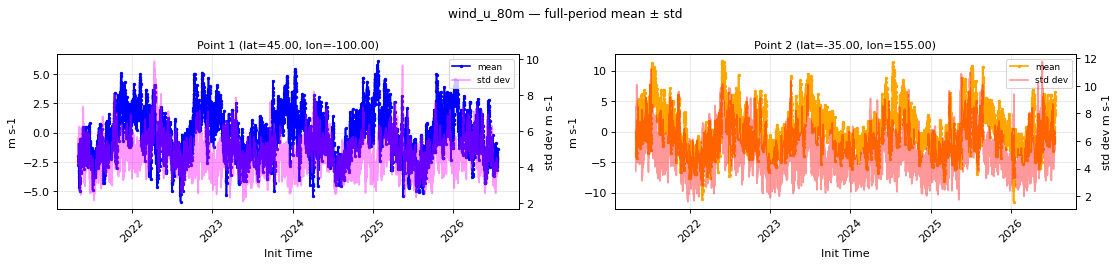
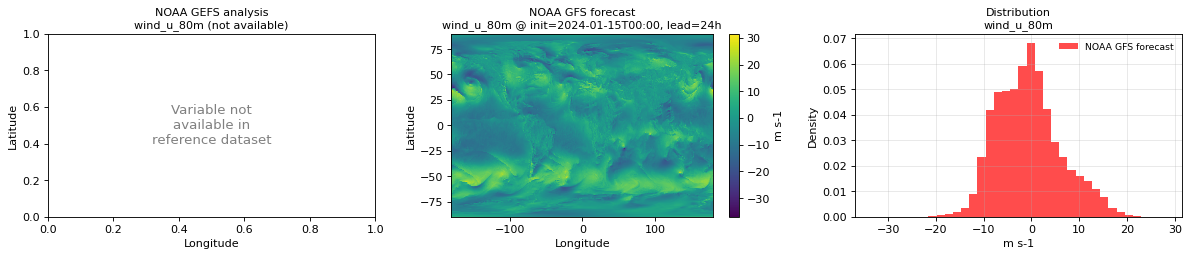
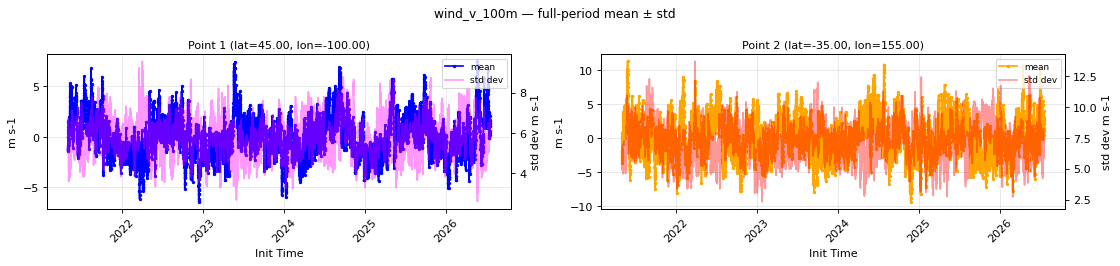
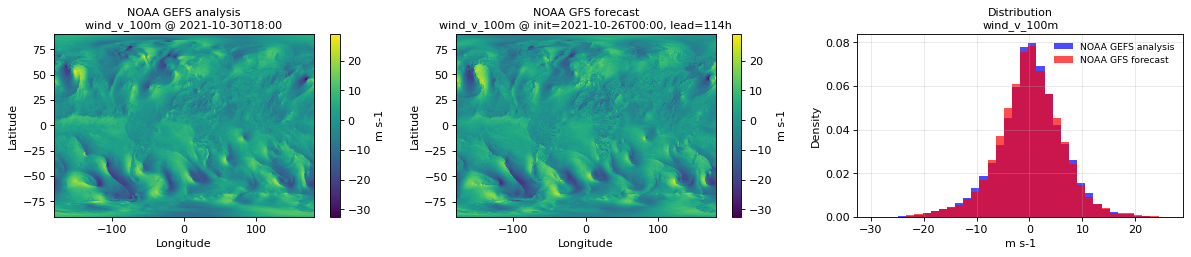
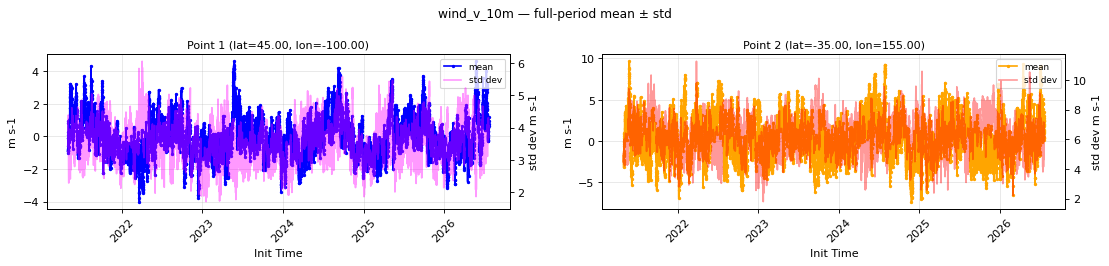
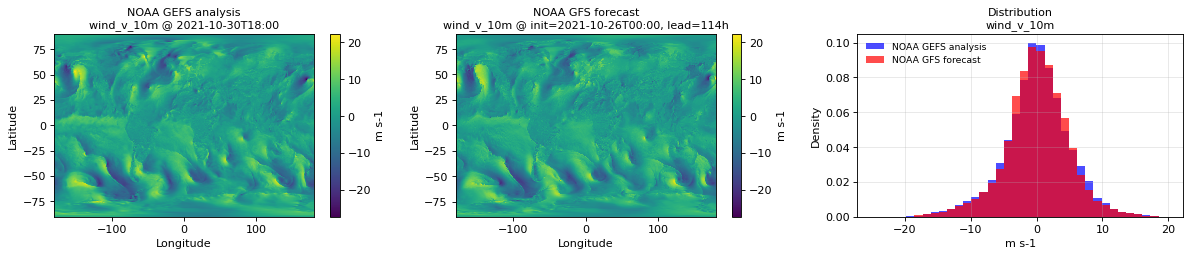
- The four new 80 m variables are correct. 80 metre temperature, 80 metre pressure, and the 80 metre U and V wind components are complete over the full archive (no gaps beyond the shared upstream one noted below). Their spatial maps have correct global geometry and land–sea placement: 80 metre temperature closely tracks 2 metre temperature (init=2024-01-15T00 + 24 h snapshot: range −46.5 to +37.3 °C, mean 3.8 °C); 80 metre pressure reproduces terrain (low over the Tibetan Plateau, the Andes, and Antarctica) and sits about 1 kPa below surface pressure, as expected for the added height; and the wind components are near-zero-mean with the coherent mid-latitude zonal (U) and synoptic (V) structure, slightly stronger than the 10 metre winds as expected for the boundary-layer profile. Full-period mean/spread series are smooth with no unit step-changes, temporal plots show in-phase diurnal cycles over land, and histograms show no sentinel spikes or quantization banding. These variables have no NOAA GEFS counterpart, so they are shown validation-only.
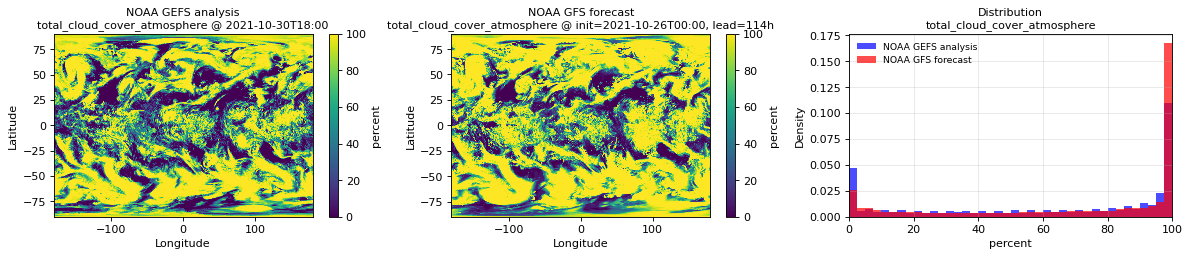
- Across all variables the validation maps match the NOAA GEFS reference in continental placement and feature alignment on the 0.25° global grid (latitude north-up, longitude −180° to +180°), with no flipped axes, missing seams, or off-grid coordinates.
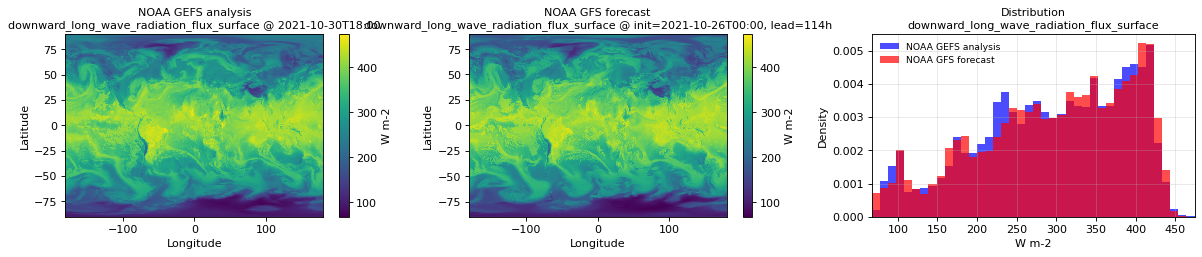
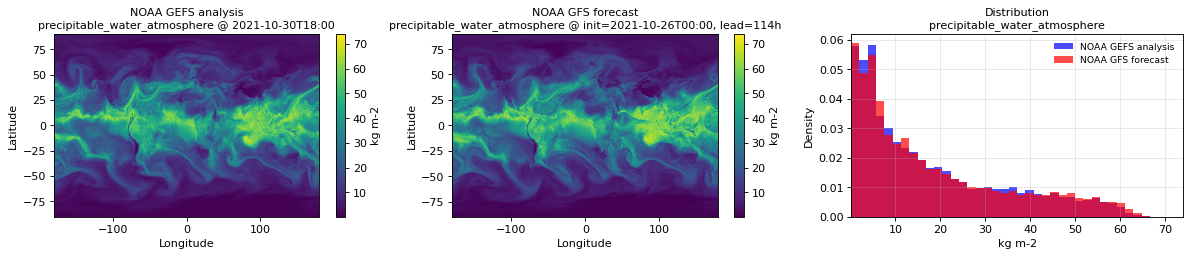
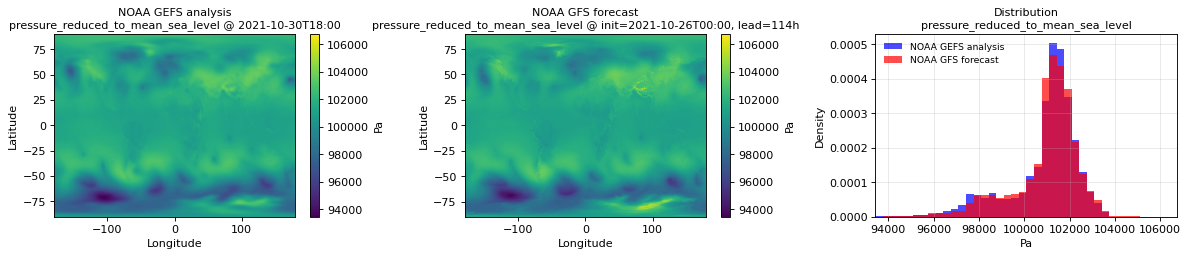
- Validation and reference histograms overlap for every comparable variable, with no unit-scale offsets. Physical ranges are realistic across the global snapshot at init=2024-01-15T00 + 24 h lead: temperature roughly −52 to +39 °C, surface pressure 48.4 to 106.7 kPa, mean sea-level pressure 95.7 to 106.8 kPa, 10 m winds within ±33 m/s, precipitable water 0.23 to 76.5 kg/m², downward shortwave radiation 0 to 1012 W/m², downward longwave radiation 96 to 488 W/m².
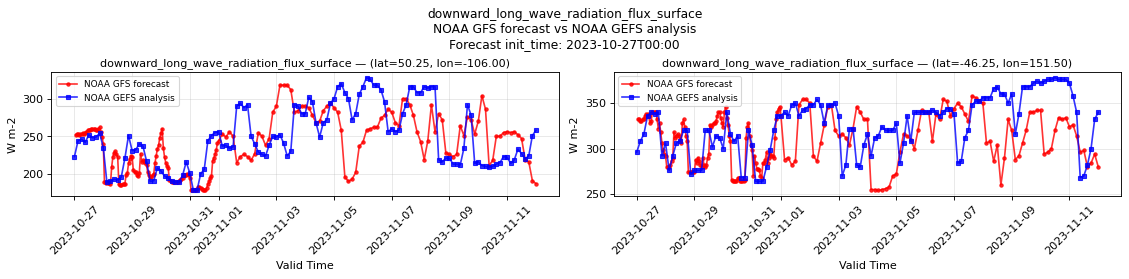
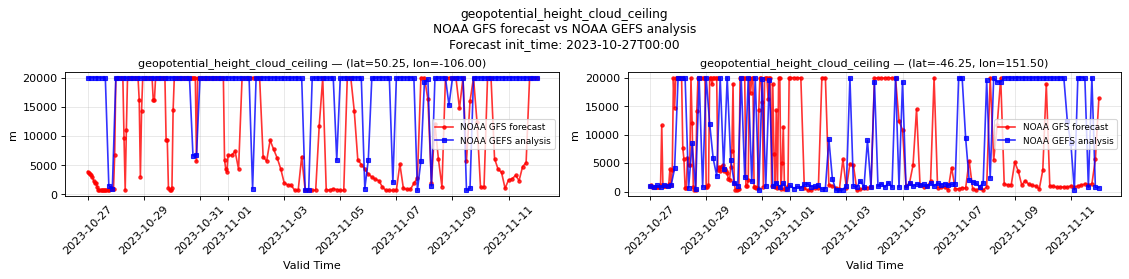
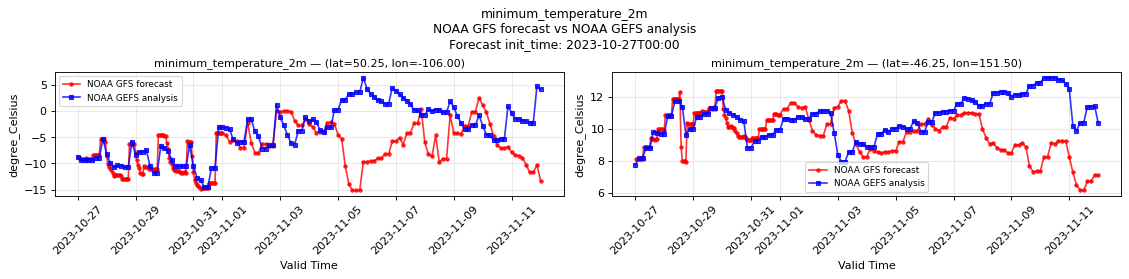
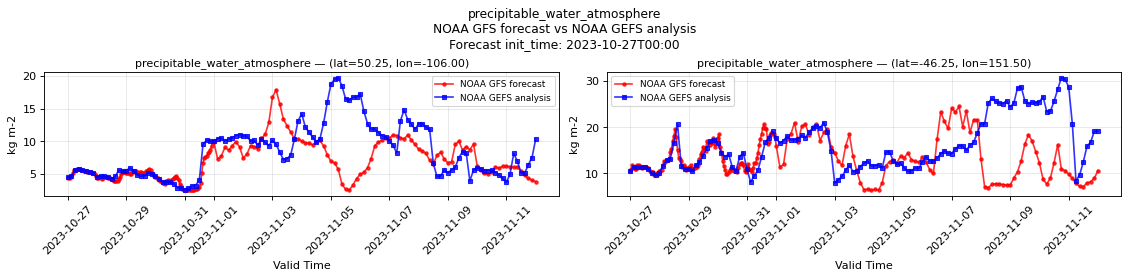
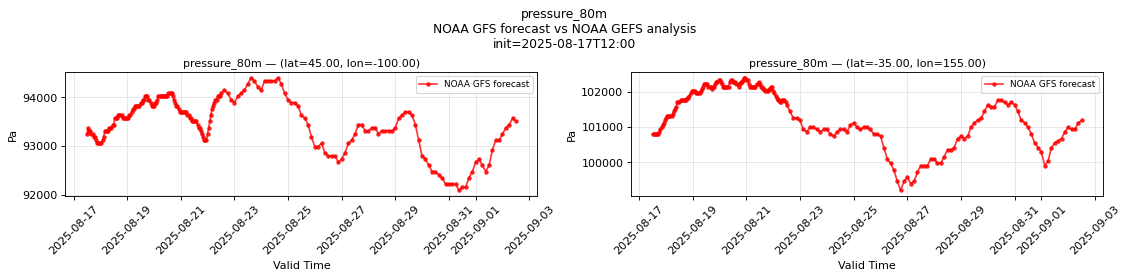
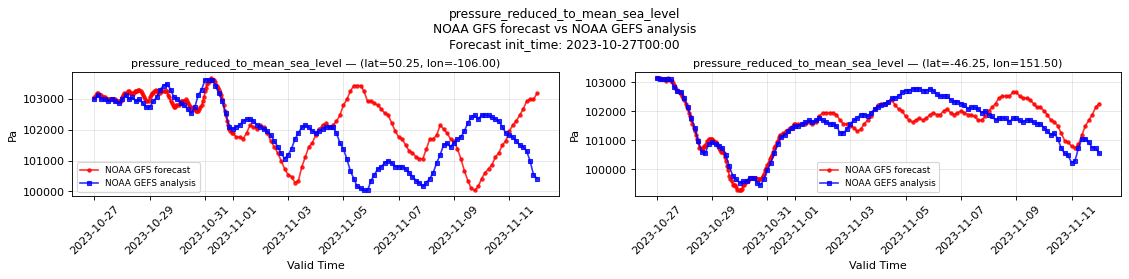
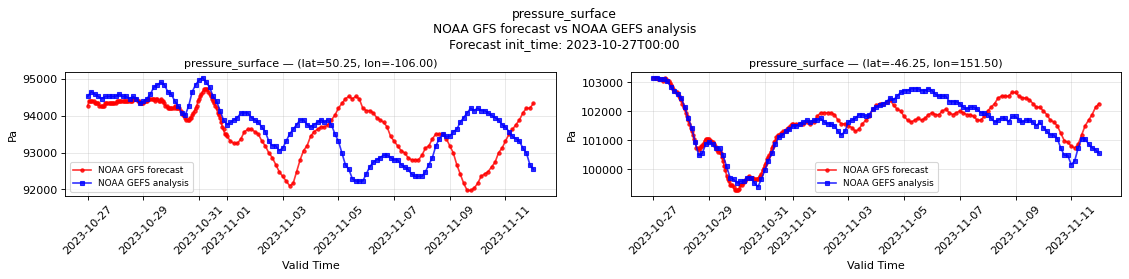
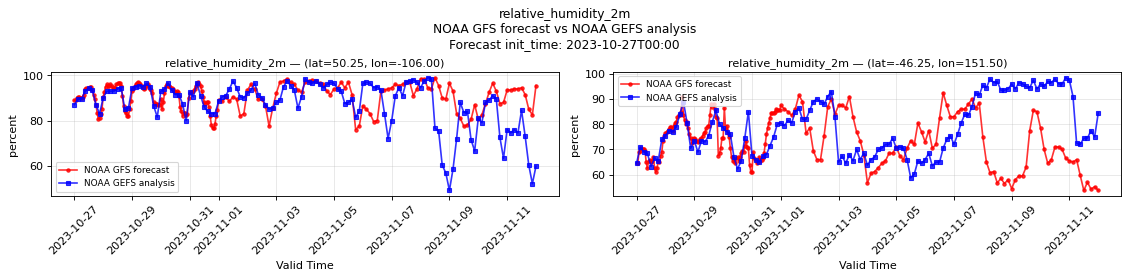
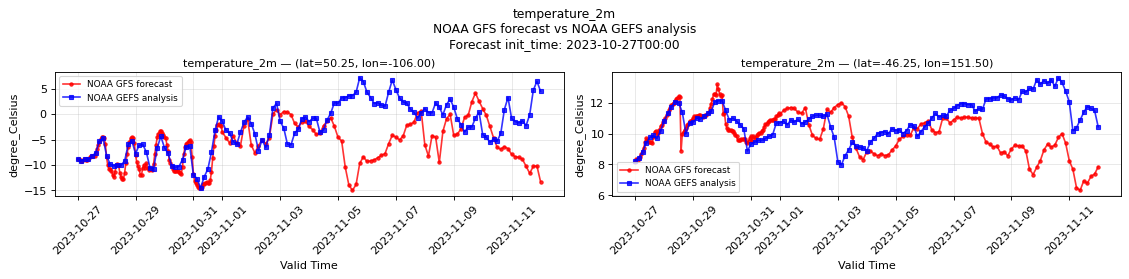
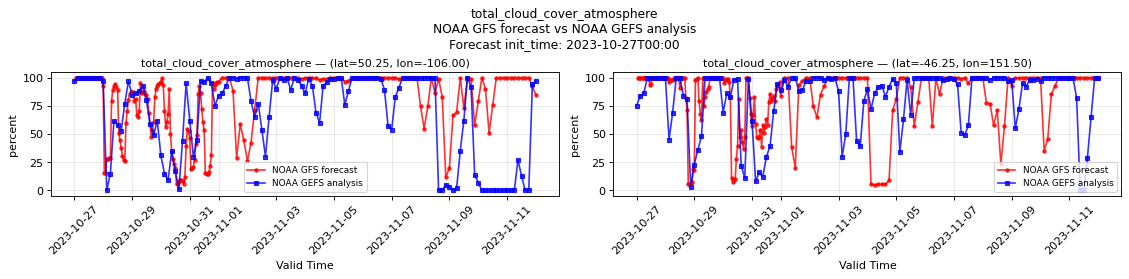
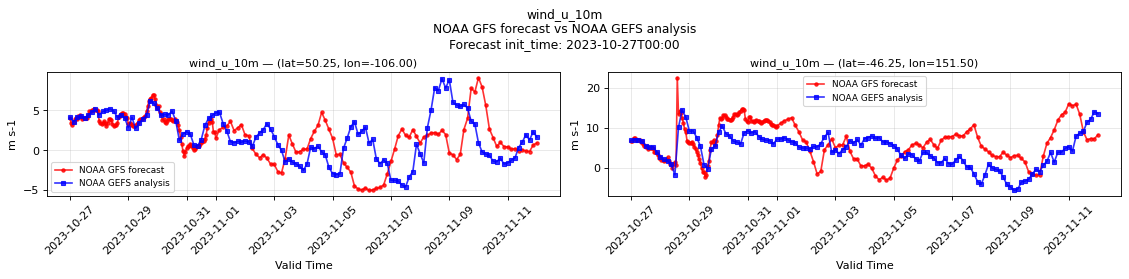
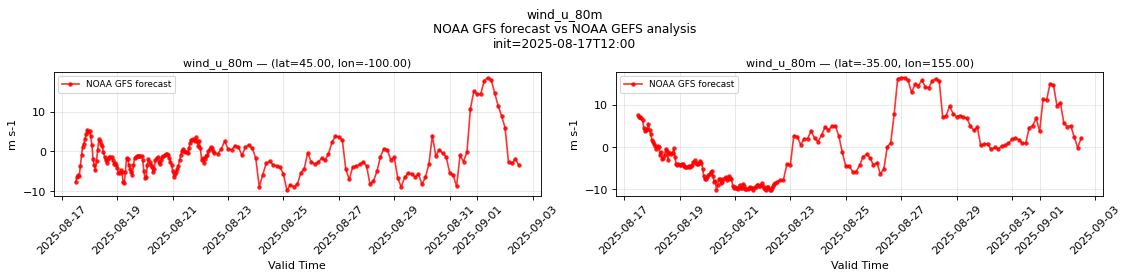
- Time series at both sampled points (lat 45.0°N, lon −100.0°E in the North American interior; lat −35.0°S, lon 155.0°E in the Tasman Sea) track the NOAA GEFS analysis reference closely for temperature, pressure, humidity, wind, and precipitable water; diurnal cycles in shortwave radiation and 2 m / 80 m temperature are in phase; categorical and accumulated variables align with reference timing. Divergence beyond ~day 5 of lead time reflects normal forecast skill decay rather than a data issue.
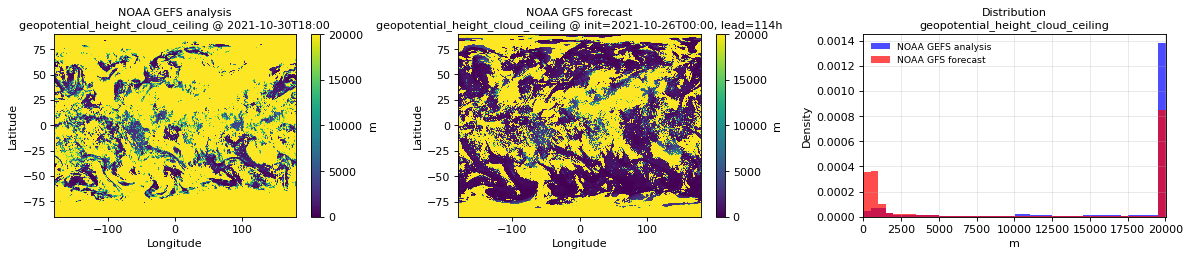
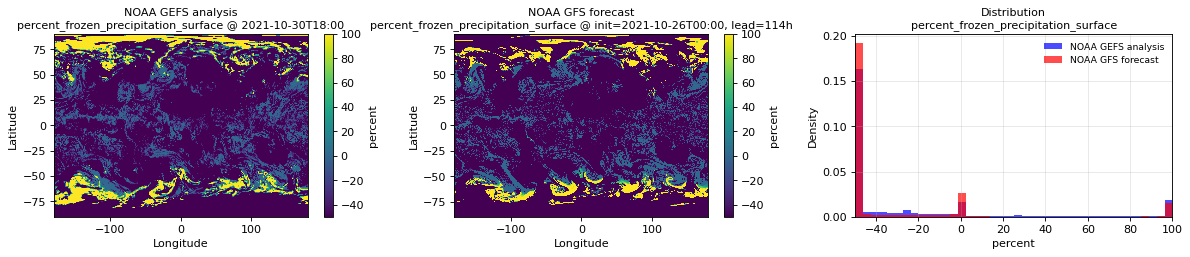
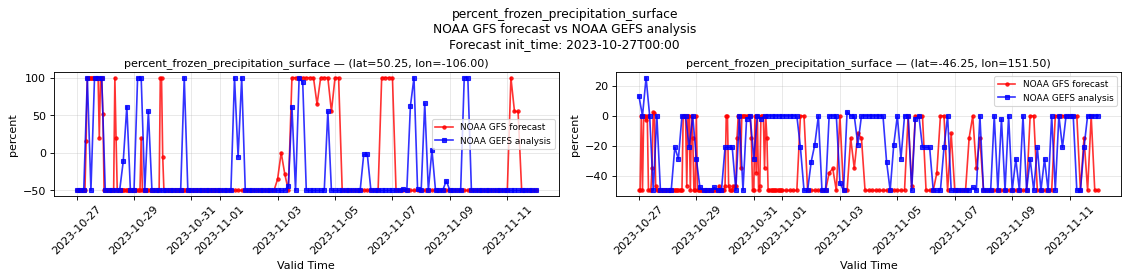
- No unexpected nulls outside the documented upstream gap. No quantization banding, sentinel-value bleed-through (the 20 km cloud-ceiling and −50 % frozen-precipitation-fraction values both also appear in the GEFS reference and are upstream GRIB conventions for "no ceiling" / "no precipitation"), or unit mismatches were observed.
Review notes
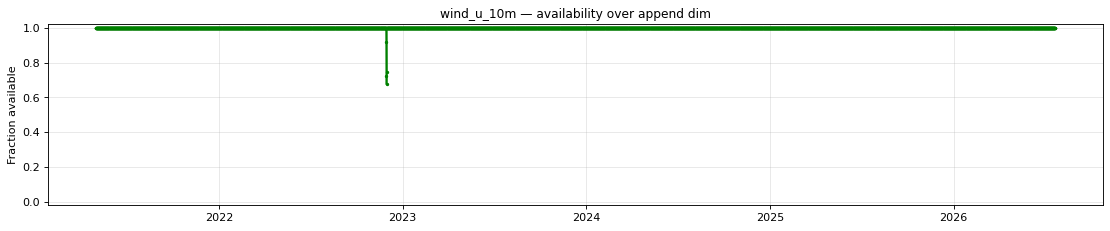
- Unavailable values 2022-11-29 → 2022-11-30 (all variables, four affected init cycles: 2022-11-29T12Z, 2022-11-29T18Z, 2022-11-30T00Z, 2022-11-30T06Z). The upstream
s3://noaa-gfs-bdp-pds/archive published.idxbyte-index sidecars for these init cycles whose byte offsets do not align with the GRIB message boundaries in the corresponding GRIB files; the byte-range download path trusts those offsets and the partial bytes returned are not valid GRIB. Direct inspection of the underlying GRIB files confirms the data is intact at the source — only the published index is wrong. We are attempting to have these fixed at the source and will backfill once that has happened. Visible inavailability_temperature_2m.pngand every otheravailability_<var>.png.
Datasets
| Role | Name | ID | Version | URL |
|---|---|---|---|---|
| Validation | NOAA GFS forecast | noaa-gfs-forecast |
v0.2.7 |
s3://us-west-2.opendata.source.coop/dynamical/noaa-gfs-forecast/v0.2.7.zarr |
| Reference | NOAA GEFS analysis | noaa-gefs-analysis |
0.1.2 |
s3://dynamical-noaa-gefs/noaa-gefs-analysis/v0.1.2.icechunk/ |
Run parameters
| Parameter | Value |
|---|---|
| Validation dataset type | forecast |
| Validation time range | init_time 2021-05-01T00:00 → 2026-07-21T12:00 |
| Reference time range | time 2000-01-01T00:00 → 2026-07-21T12:00 |
| Point 1 | lat=45.0000, lon=-100.0000 |
| Point 2 | lat=-35.0000, lon=155.0000 |
| Spatial comparison time | init=2024-01-15T00:00, lead=24h (reference at 2024-01-16T00:00) |
| Timeseries period | init=2025-08-17T12:00 |
| Vertical level | middle level per vertical dim |
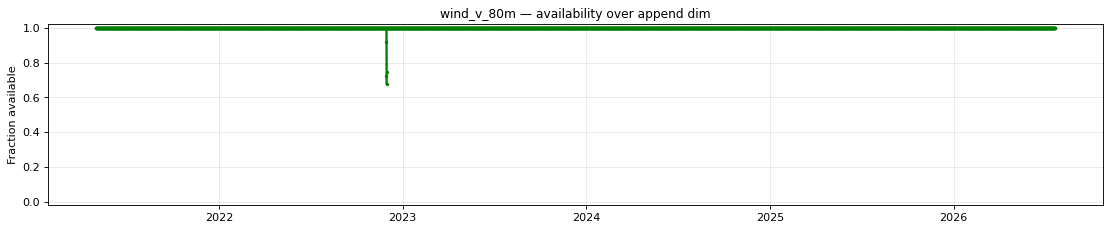
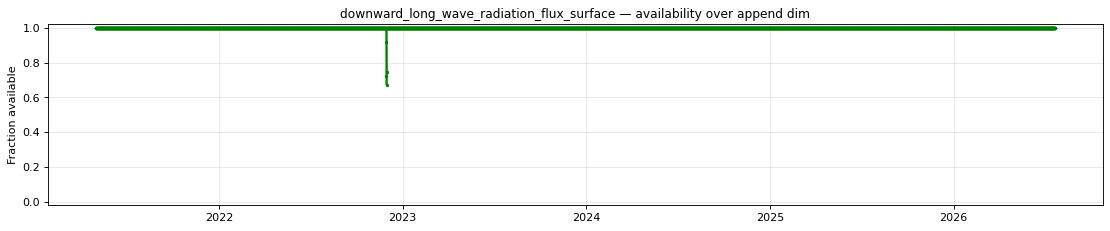
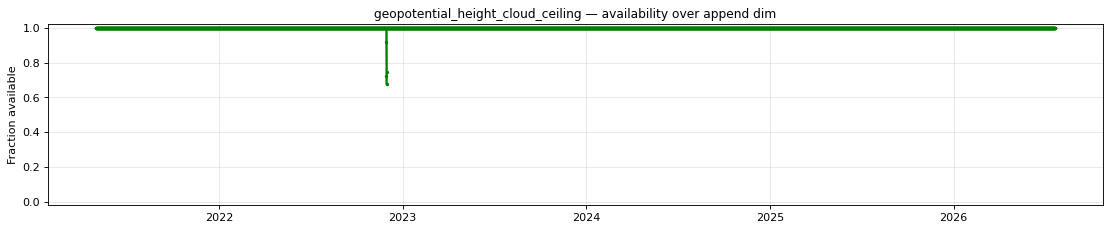
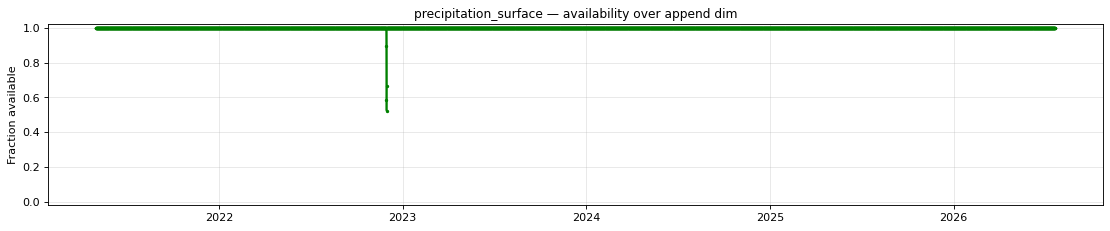
Availability
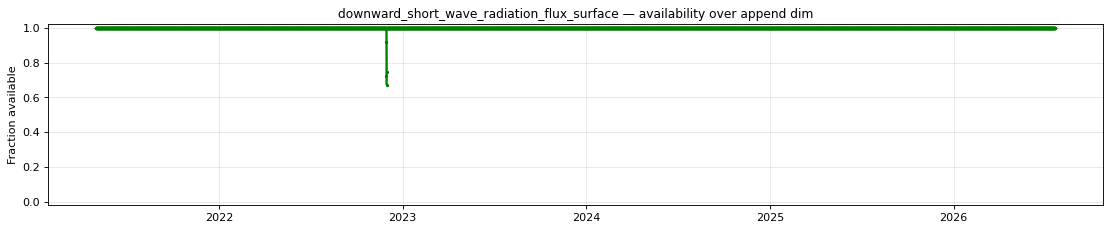
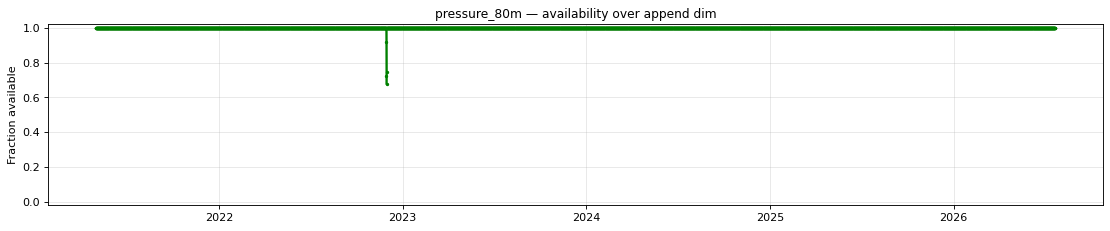
The plot below shows the availability of each variable over time — light red marks unavailable data, dark green marks present data.
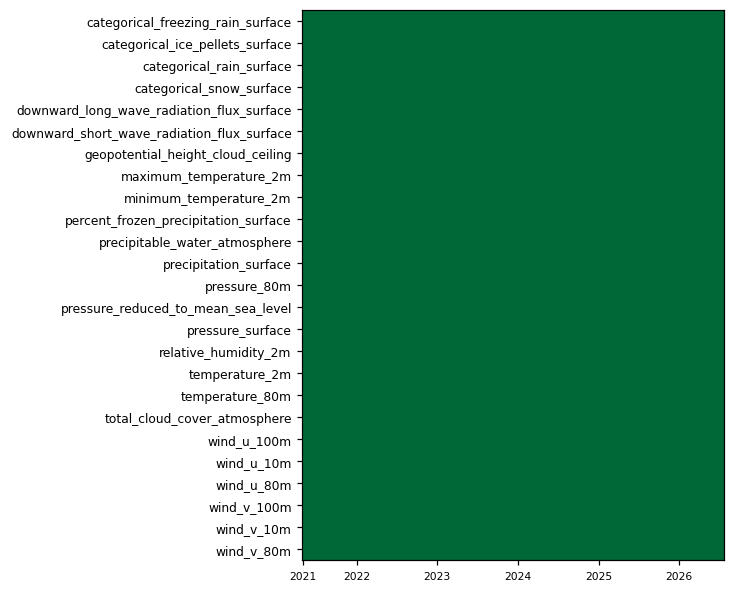
| Variable | Complete positions | Incomplete % | First incomplete | Last incomplete |
|---|---|---|---|---|
categorical_freezing_rain_surface |
7627/7631 | 0.05% | 2022-11-29T12:00 | 2022-11-30T06:00 |
categorical_ice_pellets_surface |
7627/7631 | 0.05% | 2022-11-29T12:00 | 2022-11-30T06:00 |
categorical_rain_surface |
7627/7631 | 0.05% | 2022-11-29T12:00 | 2022-11-30T06:00 |
categorical_snow_surface |
7627/7631 | 0.05% | 2022-11-29T12:00 | 2022-11-30T06:00 |
downward_long_wave_radiation_flux_surface |
7627/7631 | 0.05% | 2022-11-29T12:00 | 2022-11-30T06:00 |
downward_short_wave_radiation_flux_surface |
7627/7631 | 0.05% | 2022-11-29T12:00 | 2022-11-30T06:00 |
geopotential_height_cloud_ceiling |
7627/7631 | 0.05% | 2022-11-29T12:00 | 2022-11-30T06:00 |
maximum_temperature_2m |
7627/7631 | 0.05% | 2022-11-29T12:00 | 2022-11-30T06:00 |
minimum_temperature_2m |
7627/7631 | 0.05% | 2022-11-29T12:00 | 2022-11-30T06:00 |
percent_frozen_precipitation_surface |
7627/7631 | 0.05% | 2022-11-29T12:00 | 2022-11-30T06:00 |
precipitable_water_atmosphere |
7627/7631 | 0.05% | 2022-11-29T12:00 | 2022-11-30T06:00 |
precipitation_surface |
7625/7631 | 0.08% | 2022-11-29T12:00 | 2023-01-30T12:00 |
pressure_80m |
7627/7631 | 0.05% | 2022-11-29T12:00 | 2022-11-30T06:00 |
pressure_reduced_to_mean_sea_level |
7627/7631 | 0.05% | 2022-11-29T12:00 | 2022-11-30T06:00 |
pressure_surface |
7627/7631 | 0.05% | 2022-11-29T12:00 | 2022-11-30T06:00 |
relative_humidity_2m |
7627/7631 | 0.05% | 2022-11-29T12:00 | 2022-11-30T06:00 |
temperature_2m |
7627/7631 | 0.05% | 2022-11-29T12:00 | 2022-11-30T06:00 |
temperature_80m |
7627/7631 | 0.05% | 2022-11-29T12:00 | 2022-11-30T06:00 |
total_cloud_cover_atmosphere |
7627/7631 | 0.05% | 2022-11-29T12:00 | 2022-11-30T06:00 |
wind_u_100m |
7627/7631 | 0.05% | 2022-11-29T12:00 | 2022-11-30T06:00 |
wind_u_10m |
7627/7631 | 0.05% | 2022-11-29T12:00 | 2022-11-30T06:00 |
wind_u_80m |
7627/7631 | 0.05% | 2022-11-29T12:00 | 2022-11-30T06:00 |
wind_v_100m |
7627/7631 | 0.05% | 2022-11-29T12:00 | 2022-11-30T06:00 |
wind_v_10m |
7627/7631 | 0.05% | 2022-11-29T12:00 | 2022-11-30T06:00 |
wind_v_80m |
7627/7631 | 0.05% | 2022-11-29T12:00 | 2022-11-30T06:00 |
- Unavailable timestamps:
unavailable_timestamps.txt
Per-variable details
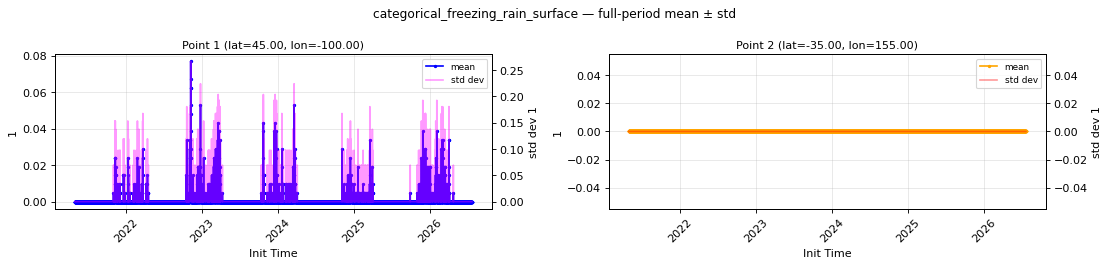
categorical_freezing_rain_surface
Metadata
| Field | Value |
|---|---|
| units | 1 |
| long_name | Categorical freezing rain |
| short_name | cfrzr |
| standard_name | n/a |
| step_type | avg |
| flag_values | 0, 1 |
| flag_meanings | no yes |
Point time series — 2021-05-01T00:00 - 2026-07-21T12:00
| Point | min | mean | std | max |
|---|---|---|---|---|
| P1 | 0 | 0.0008373 | 0.00725 | 0.07692 |
| P2 | 0 | 0 | 0 | 0 |
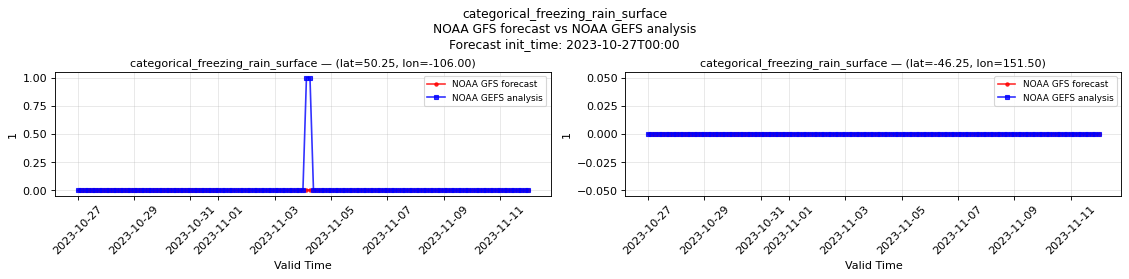
Spatial — init=2024-01-15T00:00, lead=24h (reference at 2024-01-16T00:00)
| Source | min | mean | max |
|---|---|---|---|
| Validation | 0 | 0.0002687 | 1 |
| Reference | 0 | 0.0003862 | 1 |
Temporal — init=2025-08-17T12:00
| Source | min | mean | max |
|---|---|---|---|
| P1 Validation | 0 | 0 | 0 |
| P1 Reference | 0 | 0 | 0 |
| P2 Validation | 0 | 0 | 0 |
| P2 Reference | 0 | 0 | 0 |
Availability — 7627 of 7631 positions complete (incomplete 2022-11-29T12:00 → 2022-11-30T06:00); nulls P1 196/1587248, P2 196/1587248


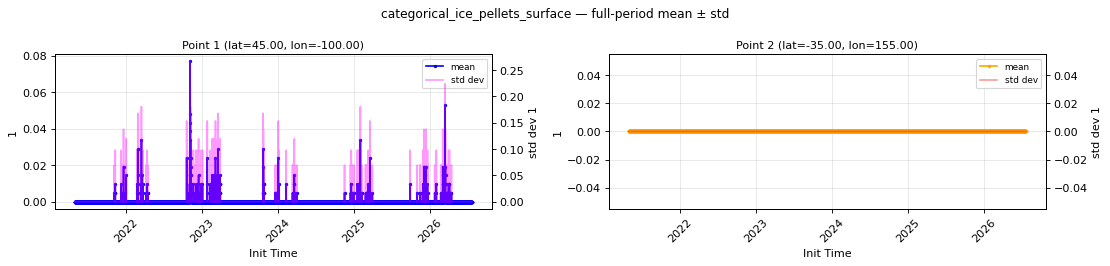
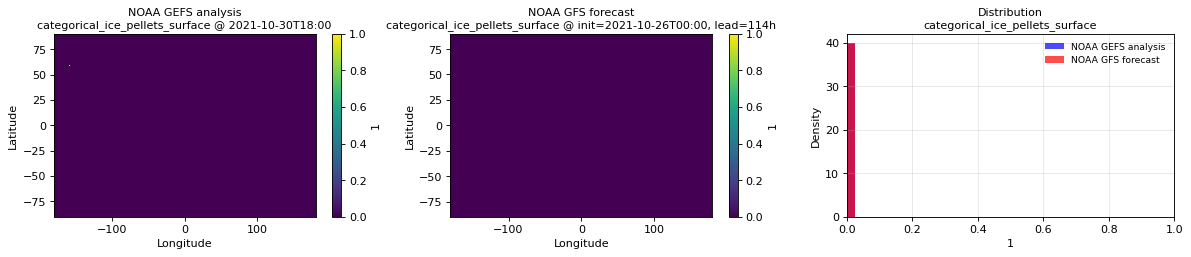
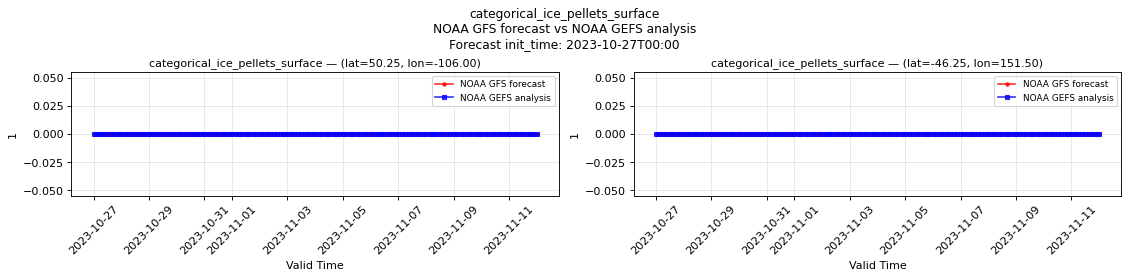
categorical_ice_pellets_surface
Metadata
| Field | Value |
|---|---|
| units | 1 |
| long_name | Categorical ice pellets |
| short_name | cicep |
| standard_name | n/a |
| step_type | avg |
| flag_values | 0, 1 |
| flag_meanings | no yes |
Point time series — 2021-05-01T00:00 - 2026-07-21T12:00
| Point | min | mean | std | max |
|---|---|---|---|---|
| P1 | 0 | 0.0003194 | 0.003081 | 0.07692 |
| P2 | 0 | 0 | 0 | 0 |
Spatial — init=2024-01-15T00:00, lead=24h (reference at 2024-01-16T00:00)
| Source | min | mean | max |
|---|---|---|---|
| Validation | 0 | 0.0001686 | 1 |
| Reference | 0 | 0.0003506 | 1 |
Temporal — init=2025-08-17T12:00
| Source | min | mean | max |
|---|---|---|---|
| P1 Validation | 0 | 0 | 0 |
| P1 Reference | 0 | 0 | 0 |
| P2 Validation | 0 | 0 | 0 |
| P2 Reference | 0 | 0 | 0 |
Availability — 7627 of 7631 positions complete (incomplete 2022-11-29T12:00 → 2022-11-30T06:00); nulls P1 196/1587248, P2 196/1587248

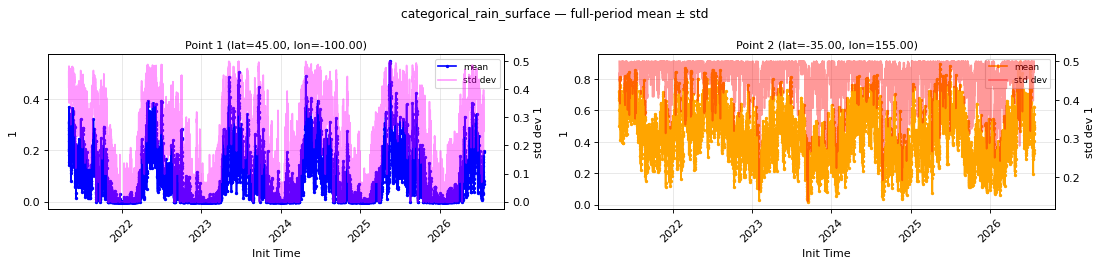
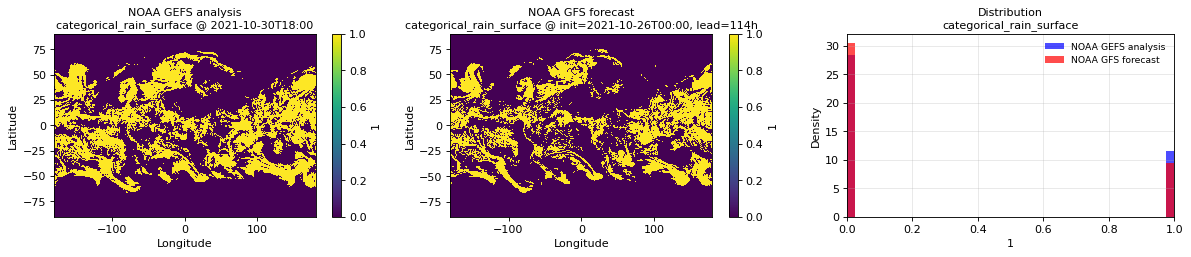
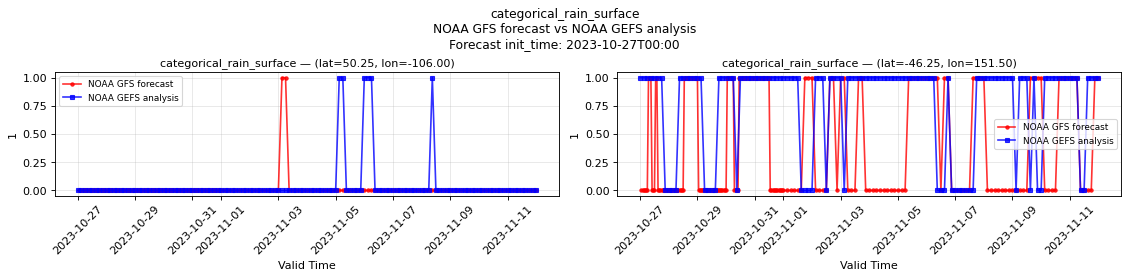
categorical_rain_surface
Metadata
| Field | Value |
|---|---|
| units | 1 |
| long_name | Categorical rain |
| short_name | crain |
| standard_name | n/a |
| step_type | avg |
| flag_values | 0, 1 |
| flag_meanings | no yes |
Point time series — 2021-05-01T00:00 - 2026-07-21T12:00
| Point | min | mean | std | max |
|---|---|---|---|---|
| P1 | 0 | 0.09145 | 0.2234 | 0.5481 |
| P2 | 0.01923 | 0.4458 | 0.4655 | 0.9135 |
Spatial — init=2024-01-15T00:00, lead=24h (reference at 2024-01-16T00:00)
| Source | min | mean | max |
|---|---|---|---|
| Validation | 0 | 0.2312 | 1 |
| Reference | 0 | 0.2906 | 1 |
Temporal — init=2025-08-17T12:00
| Source | min | mean | max |
|---|---|---|---|
| P1 Validation | 0 | 0.07212 | 1 |
| P1 Reference | 0 | 0.1473 | 1 |
| P2 Validation | 0 | 0.5529 | 1 |
| P2 Reference | 0 | 0.6512 | 1 |
Availability — 7627 of 7631 positions complete (incomplete 2022-11-29T12:00 → 2022-11-30T06:00); nulls P1 196/1587248, P2 196/1587248

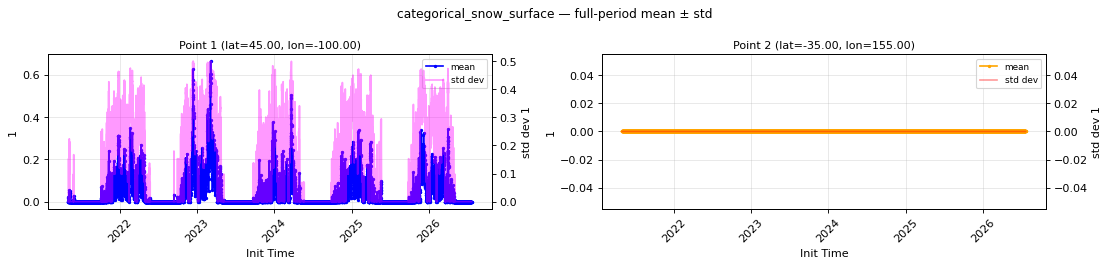
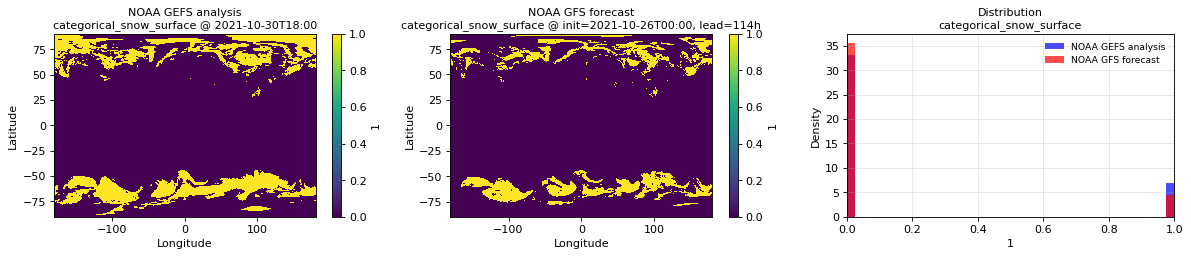
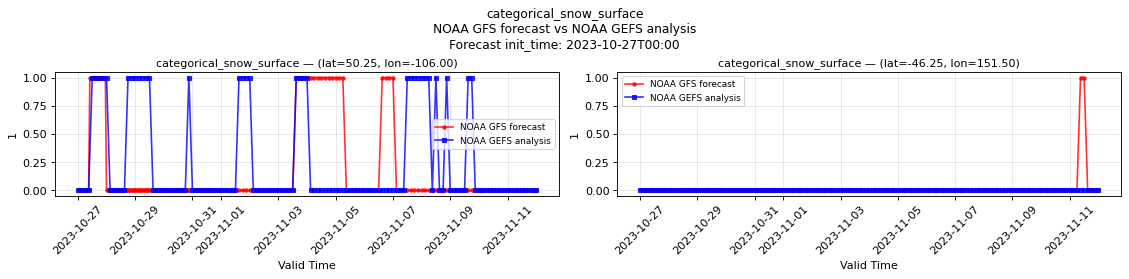
categorical_snow_surface
Metadata
| Field | Value |
|---|---|
| units | 1 |
| long_name | Categorical snow |
| short_name | csnow |
| standard_name | n/a |
| step_type | avg |
| flag_values | 0, 1 |
| flag_meanings | no yes |
Point time series — 2021-05-01T00:00 - 2026-07-21T12:00
| Point | min | mean | std | max |
|---|---|---|---|---|
| P1 | 0 | 0.04703 | 0.1279 | 0.6635 |
| P2 | 0 | 0 | 0 | 0 |
Spatial — init=2024-01-15T00:00, lead=24h (reference at 2024-01-16T00:00)
| Source | min | mean | max |
|---|---|---|---|
| Validation | 0 | 0.1048 | 1 |
| Reference | 0 | 0.1447 | 1 |
Temporal — init=2025-08-17T12:00
| Source | min | mean | max |
|---|---|---|---|
| P1 Validation | 0 | 0 | 0 |
| P1 Reference | 0 | 0 | 0 |
| P2 Validation | 0 | 0 | 0 |
| P2 Reference | 0 | 0 | 0 |
Availability — 7627 of 7631 positions complete (incomplete 2022-11-29T12:00 → 2022-11-30T06:00); nulls P1 196/1587248, P2 196/1587248

downward_long_wave_radiation_flux_surface
Metadata
| Field | Value |
|---|---|
| units | W m-2 |
| long_name | Surface downward long-wave radiation flux |
| short_name | sdlwrf |
| standard_name | surface_downwelling_longwave_flux_in_air |
| step_type | avg |
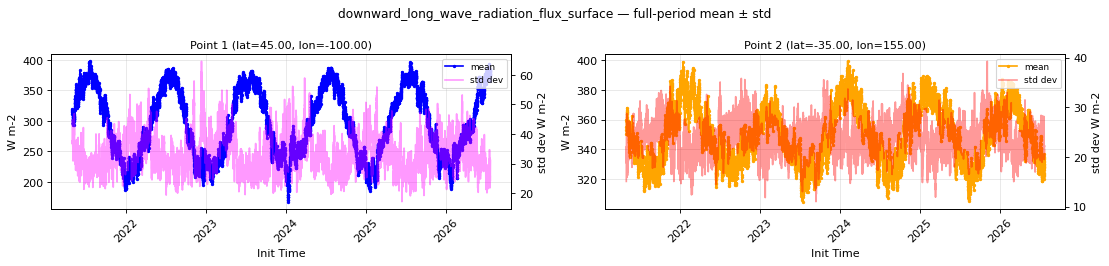
Point time series — 2021-05-01T00:00 - 2026-07-21T12:00
| Point | min | mean | std | max |
|---|---|---|---|---|
| P1 | 167.7 | 296.1 | 33.26 | 397.7 |
| P2 | 304.8 | 349.7 | 24.03 | 399.2 |
Spatial — init=2024-01-15T00:00, lead=24h (reference at 2024-01-16T00:00)
| Source | min | mean | max |
|---|---|---|---|
| Validation | 96 | 290.8 | 488 |
| Reference | 95 | 288.5 | 488 |
Temporal — init=2025-08-17T12:00
| Source | min | mean | max |
|---|---|---|---|
| P1 Validation | 284 | 371.4 | 442 |
| P1 Reference | 276 | 351.2 | 428 |
| P2 Validation | 284 | 320.5 | 394 |
| P2 Reference | 284 | 318.6 | 378 |
Availability — 7627 of 7631 positions complete (incomplete 2022-11-29T12:00 → 2022-11-30T06:00); nulls P1 196/1587248, P2 196/1587248
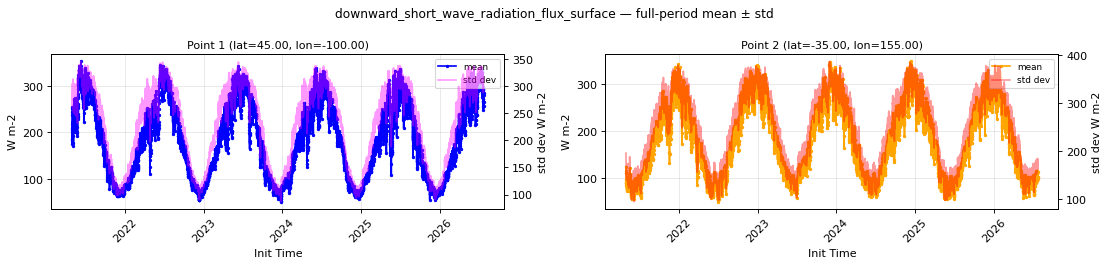
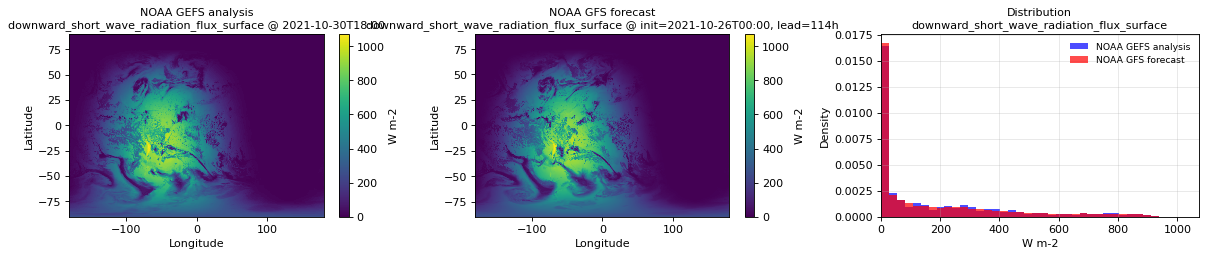
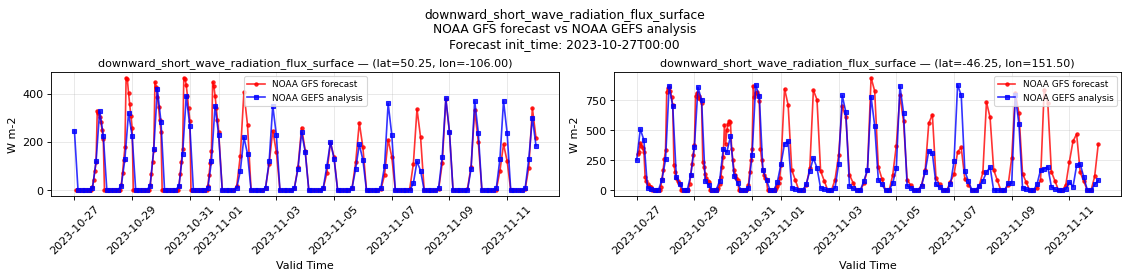
downward_short_wave_radiation_flux_surface
Metadata
| Field | Value |
|---|---|
| units | W m-2 |
| long_name | Surface downward short-wave radiation flux |
| short_name | sdswrf |
| standard_name | surface_downwelling_shortwave_flux_in_air |
| step_type | avg |
Point time series — 2021-05-01T00:00 - 2026-07-21T12:00
| Point | min | mean | std | max |
|---|---|---|---|---|
| P1 | 51.75 | 185.9 | 231.4 | 352.6 |
| P2 | 49.37 | 183.7 | 251.7 | 349.4 |
Spatial — init=2024-01-15T00:00, lead=24h (reference at 2024-01-16T00:00)
| Source | min | mean | max |
|---|---|---|---|
| Validation | 0 | 189 | 1012 |
| Reference | 0 | 192.8 | 1008 |
Temporal — init=2025-08-17T12:00
| Source | min | mean | max |
|---|---|---|---|
| P1 Validation | 0 | 261.1 | 852 |
| P1 Reference | 0 | 244.8 | 840 |
| P2 Validation | 0 | 139.2 | 724 |
| P2 Reference | 0 | 163.9 | 712 |
Availability — 7627 of 7631 positions complete (incomplete 2022-11-29T12:00 → 2022-11-30T06:00); nulls P1 196/1587248, P2 196/1587248
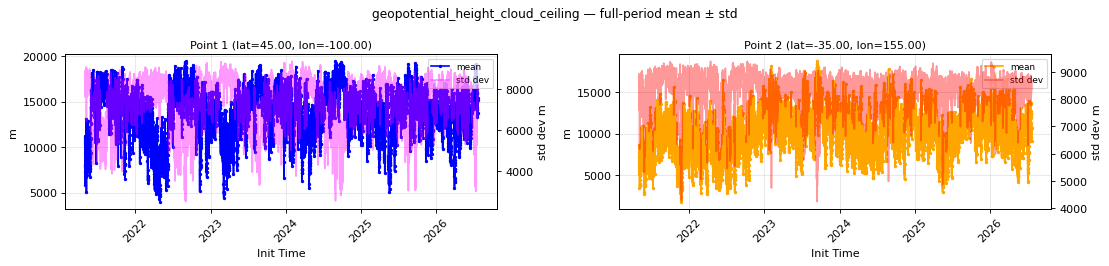
geopotential_height_cloud_ceiling
Metadata
| Field | Value |
|---|---|
| units | m |
| long_name | Geopotential height |
| short_name | gh |
| standard_name | geopotential_height |
| step_type | instant |
Point time series — 2021-05-01T00:00 - 2026-07-21T12:00
| Point | min | mean | std | max |
|---|---|---|---|---|
| P1 | 4015 | 1.38e+04 | 7380 | 1.944e+04 |
| P2 | 1800 | 1.026e+04 | 8365 | 1.873e+04 |
Spatial — init=2024-01-15T00:00, lead=24h (reference at 2024-01-16T00:00)
| Source | min | mean | max |
|---|---|---|---|
| Validation | 3.172 | 1.171e+04 | 1.997e+04 |
| Reference | 0.6758 | 1.641e+04 | 1.997e+04 |
Temporal — init=2025-08-17T12:00
| Source | min | mean | max |
|---|---|---|---|
| P1 Validation | 662 | 1.734e+04 | 2.003e+04 |
| P1 Reference | 700 | 1.782e+04 | 2.003e+04 |
| P2 Validation | 144.5 | 1.107e+04 | 2.003e+04 |
| P2 Reference | 536 | 1.172e+04 | 2.003e+04 |
Availability — 7627 of 7631 positions complete (incomplete 2022-11-29T12:00 → 2022-11-30T06:00); nulls P1 196/1594879, P2 196/1594879
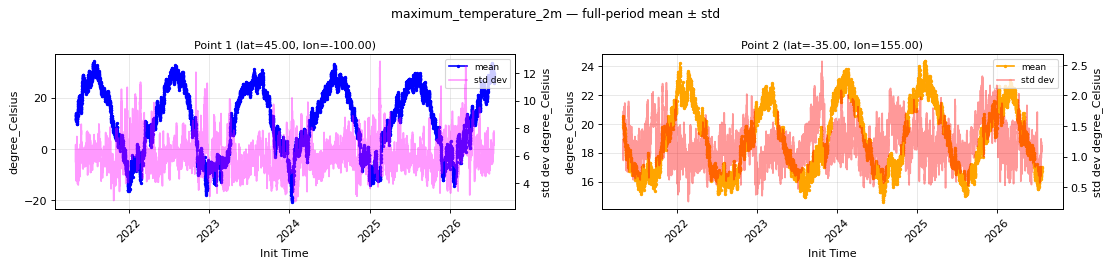
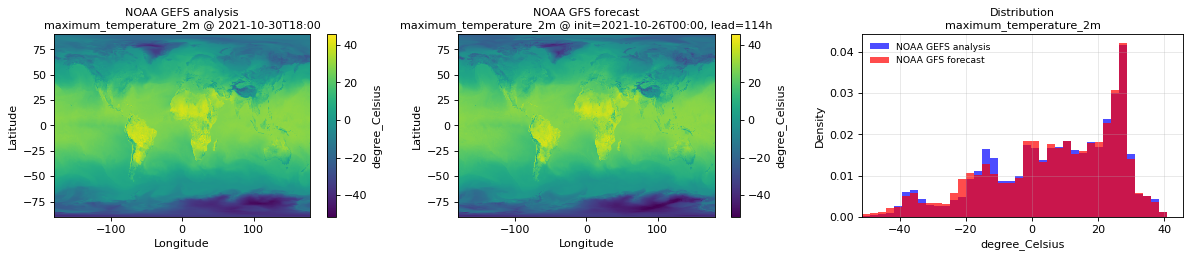
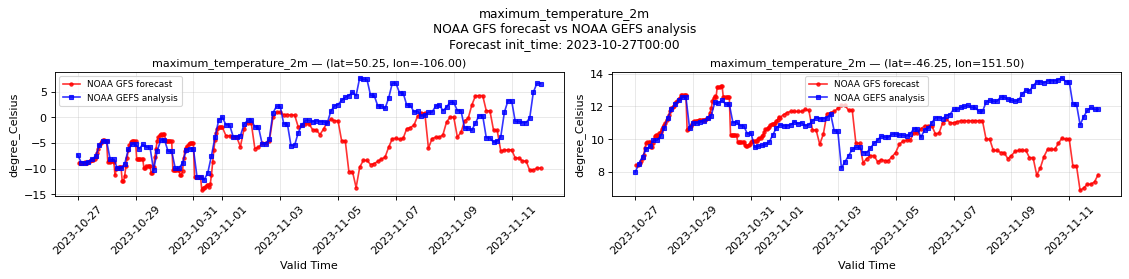
maximum_temperature_2m
Metadata
| Field | Value |
|---|---|
| units | degree_Celsius |
| long_name | Maximum temperature |
| short_name | tmax |
| standard_name | air_temperature |
| step_type | max |
Point time series — 2021-05-01T00:00 - 2026-07-21T12:00
| Point | min | mean | std | max |
|---|---|---|---|---|
| P1 | -20.51 | 11.12 | 6.029 | 34.18 |
| P2 | 14.61 | 18.99 | 1.208 | 24.33 |
Spatial — init=2024-01-15T00:00, lead=24h (reference at 2024-01-16T00:00)
| Source | min | mean | max |
|---|---|---|---|
| Validation | -51.25 | 4.605 | 43 |
| Reference | -43.5 | 4.852 | 43 |
Temporal — init=2025-08-17T12:00
| Source | min | mean | max |
|---|---|---|---|
| P1 Validation | 10.81 | 28.47 | 40.25 |
| P1 Reference | 11.44 | 24.25 | 37.75 |
| P2 Validation | 13.56 | 15.93 | 19.25 |
| P2 Reference | 13.81 | 16.4 | 19 |
Availability — 7627 of 7631 positions complete (incomplete 2022-11-29T12:00 → 2022-11-30T06:00); nulls P1 196/1587248, P2 196/1587248

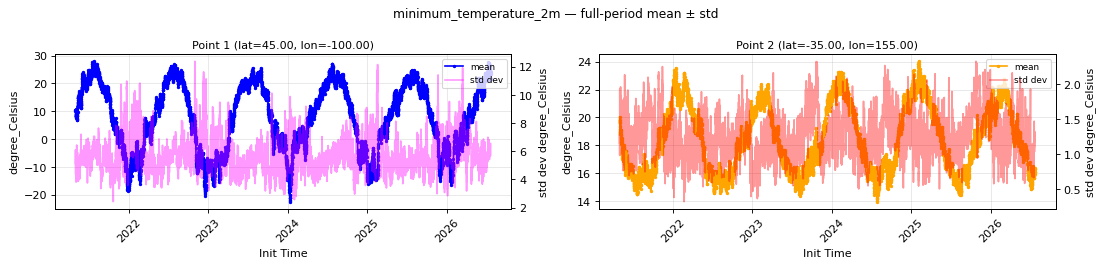
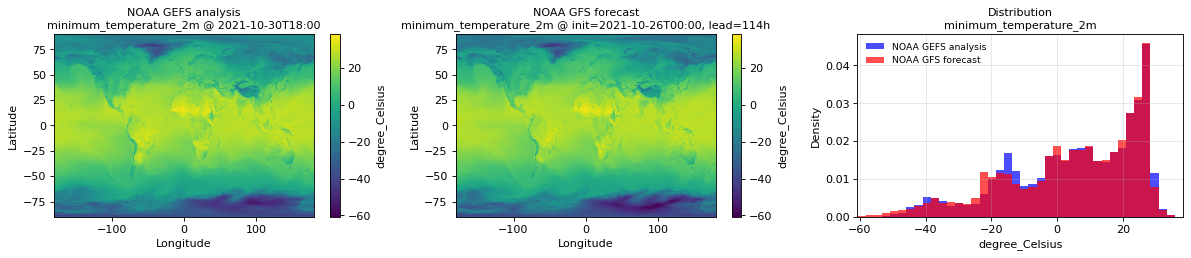
minimum_temperature_2m
Metadata
| Field | Value |
|---|---|
| units | degree_Celsius |
| long_name | Minimum temperature |
| short_name | tmin |
| standard_name | air_temperature |
| step_type | min |
Point time series — 2021-05-01T00:00 - 2026-07-21T12:00
| Point | min | mean | std | max |
|---|---|---|---|---|
| P1 | -22.52 | 7.78 | 5.692 | 27.95 |
| P2 | 13.97 | 18.45 | 1.257 | 24.02 |
Spatial — init=2024-01-15T00:00, lead=24h (reference at 2024-01-16T00:00)
| Source | min | mean | max |
|---|---|---|---|
| Validation | -52 | 2.893 | 37 |
| Reference | -48.5 | 3.253 | 36.25 |
Temporal — init=2025-08-17T12:00
| Source | min | mean | max |
|---|---|---|---|
| P1 Validation | 9.125 | 23.33 | 37.5 |
| P1 Reference | 9.5 | 19.7 | 36 |
| P2 Validation | 12.12 | 15.34 | 17.75 |
| P2 Reference | 13.31 | 15.89 | 18 |
Availability — 7627 of 7631 positions complete (incomplete 2022-11-29T12:00 → 2022-11-30T06:00); nulls P1 196/1587248, P2 196/1587248

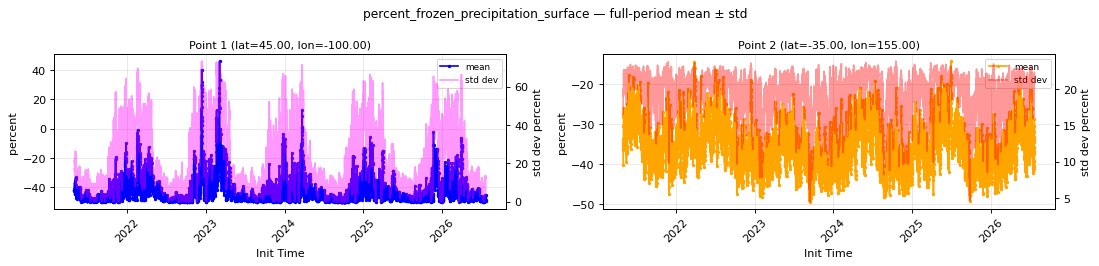
percent_frozen_precipitation_surface
Metadata
| Field | Value |
|---|---|
| units | percent |
| long_name | Percent frozen precipitation |
| short_name | cpofp |
| standard_name | n/a |
| step_type | instant |
Point time series — 2021-05-01T00:00 - 2026-07-21T12:00
| Point | min | mean | std | max |
|---|---|---|---|---|
| P1 | -50 | -42.34 | 21.08 | 46.04 |
| P2 | -49.44 | -35.47 | 19.45 | -14.28 |
Spatial — init=2024-01-15T00:00, lead=24h (reference at 2024-01-16T00:00)
| Source | min | mean | max |
|---|---|---|---|
| Validation | -50 | -31.76 | 100 |
| Reference | -50 | -23.75 | 100 |
Temporal — init=2025-08-17T12:00
| Source | min | mean | max |
|---|---|---|---|
| P1 Validation | -50 | -49.2 | -6.109e-06 |
| P1 Reference | -50 | -47.67 | -6.109e-06 |
| P2 Validation | -50 | -36.97 | -6.109e-06 |
| P2 Reference | -50 | -32.18 | -6.109e-06 |
Availability — 7627 of 7631 positions complete (incomplete 2022-11-29T12:00 → 2022-11-30T06:00); nulls P1 196/1594879, P2 196/1594879

precipitable_water_atmosphere
Metadata
| Field | Value |
|---|---|
| units | kg m-2 |
| long_name | Precipitable water |
| short_name | pwat |
| standard_name | atmosphere_mass_content_of_water_vapor |
| step_type | instant |
Point time series — 2021-05-01T00:00 - 2026-07-21T12:00
| Point | min | mean | std | max |
|---|---|---|---|---|
| P1 | 2.202 | 15.71 | 4.963 | 37.04 |
| P2 | 12.85 | 22.31 | 6.104 | 42.02 |
Spatial — init=2024-01-15T00:00, lead=24h (reference at 2024-01-16T00:00)
| Source | min | mean | max |
|---|---|---|---|
| Validation | 0.2314 | 18.05 | 76.5 |
| Reference | 0.2002 | 17.97 | 74.5 |
Temporal — init=2025-08-17T12:00
| Source | min | mean | max |
|---|---|---|---|
| P1 Validation | 11.94 | 27.79 | 40.25 |
| P1 Reference | 10.69 | 24.86 | 38 |
| P2 Validation | 8.75 | 16.1 | 37.25 |
| P2 Reference | 10.69 | 17.15 | 28.75 |
Availability — 7627 of 7631 positions complete (incomplete 2022-11-29T12:00 → 2022-11-30T06:00); nulls P1 196/1594879, P2 196/1594879

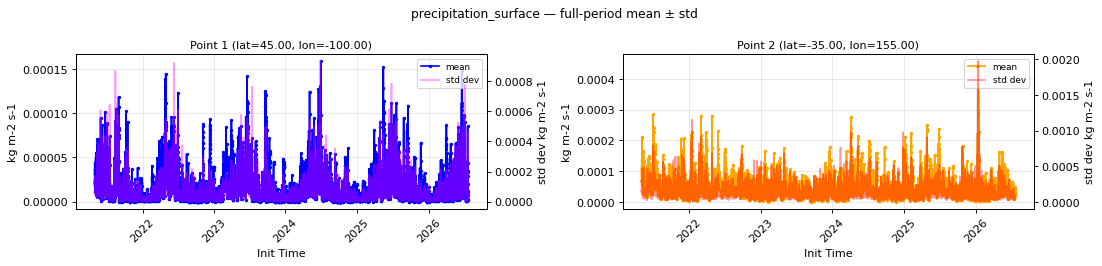
precipitation_surface
Metadata
| Field | Value |
|---|---|
| units | kg m-2 s-1 |
| long_name | Precipitation rate |
| short_name | prate |
| standard_name | precipitation_flux |
| step_type | avg |
Point time series — 2021-05-01T00:00 - 2026-07-21T12:00
| Point | min | mean | std | max |
|---|---|---|---|---|
| P1 | 0 | 1.714e-05 | 7.466e-05 | 0.000159 |
| P2 | 6.946e-07 | 4.711e-05 | 0.0001352 | 0.0004575 |
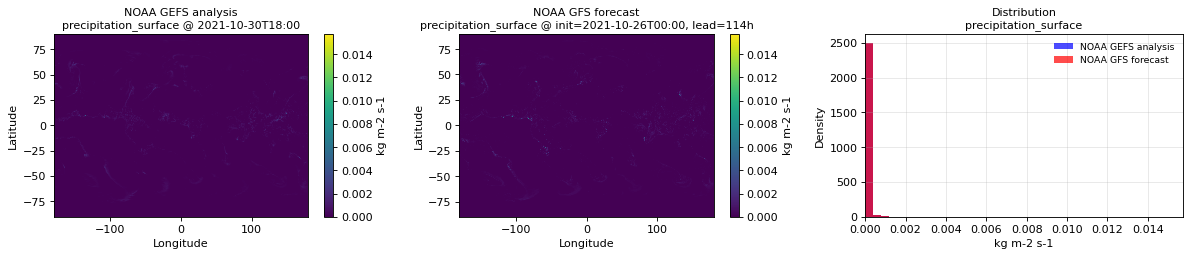
Spatial — init=2024-01-15T00:00, lead=24h (reference at 2024-01-16T00:00)
| Source | min | mean | max |
|---|---|---|---|
| Validation | 0 | 2.68e-05 | 0.0127 |
| Reference | 0 | 2.549e-05 | 0.006989 |
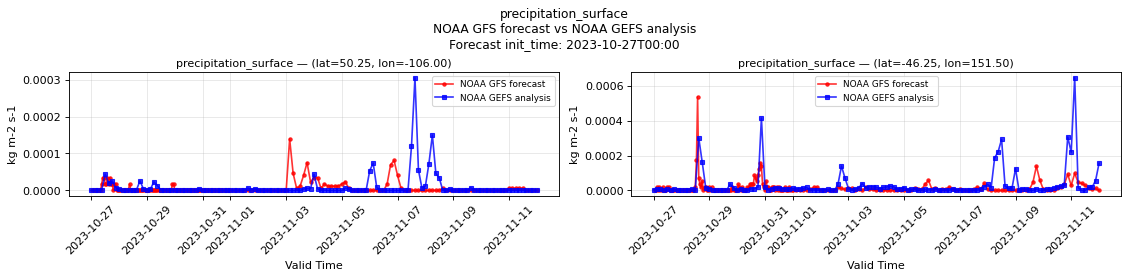
Temporal — init=2025-08-17T12:00
| Source | min | mean | max |
|---|---|---|---|
| P1 Validation | 0 | 2.117e-06 | 6.962e-05 |
| P1 Reference | 0 | 1.101e-05 | 0.00037 |
| P2 Validation | 0 | 4.59e-05 | 0.001244 |
| P2 Reference | 0 | 3.2e-05 | 0.0003986 |
Availability — 7625 of 7631 positions complete (incomplete 2022-11-29T12:00 → 2023-01-30T12:00); nulls P1 277/1587248, P2 279/1587248
pressure_80m
Metadata
| Field | Value |
|---|---|
| units | Pa |
| long_name | 80 metre pressure |
| short_name | 80sp |
| standard_name | air_pressure |
| step_type | instant |
Point time series — 2021-05-01T00:00 - 2026-07-21T12:00
| Point | min | mean | std | max |
|---|---|---|---|---|
| P1 | 9.227e+04 | 9.349e+04 | 600.7 | 9.455e+04 |
| P2 | 9.938e+04 | 1.007e+05 | 552.1 | 1.02e+05 |
Spatial — init=2024-01-15T00:00, lead=24h (reference not available)
| Source | min | mean | max |
|---|---|---|---|
| Validation | 4.784e+04 | 9.589e+04 | 1.057e+05 |
Temporal — init=2025-08-17T12:00
| Source | min | mean | max |
|---|---|---|---|
| P1 Validation | 9.21e+04 | 9.349e+04 | 9.44e+04 |
| P2 Validation | 9.92e+04 | 1.014e+05 | 1.024e+05 |
Availability — 7627 of 7631 positions complete (incomplete 2022-11-29T12:00 → 2022-11-30T06:00); nulls P1 196/1594879, P2 196/1594879
pressure_reduced_to_mean_sea_level
Metadata
| Field | Value |
|---|---|
| units | Pa |
| long_name | Pressure reduced to MSL |
| short_name | prmsl |
| standard_name | air_pressure_at_mean_sea_level |
| step_type | instant |
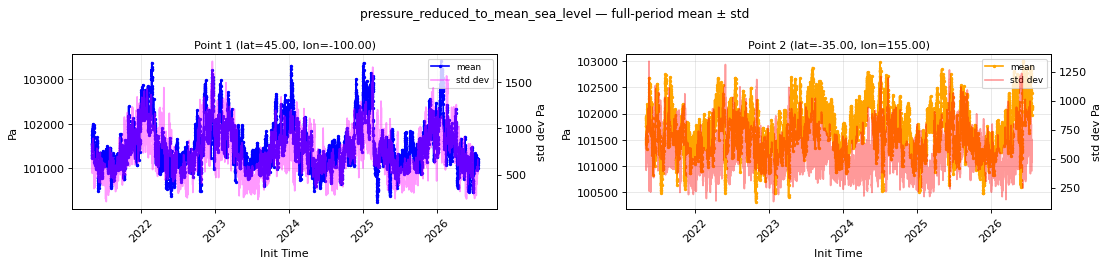
Point time series — 2021-05-01T00:00 - 2026-07-21T12:00
| Point | min | mean | std | max |
|---|---|---|---|---|
| P1 | 1.002e+05 | 1.015e+05 | 738.9 | 1.034e+05 |
| P2 | 1.003e+05 | 1.017e+05 | 558.8 | 1.03e+05 |
Spatial — init=2024-01-15T00:00, lead=24h (reference at 2024-01-16T00:00)
| Source | min | mean | max |
|---|---|---|---|
| Validation | 9.574e+04 | 1.012e+05 | 1.068e+05 |
| Reference | 9.562e+04 | 1.012e+05 | 1.055e+05 |
Temporal — init=2025-08-17T12:00
| Source | min | mean | max |
|---|---|---|---|
| P1 Validation | 9.971e+04 | 1.011e+05 | 1.023e+05 |
| P1 Reference | 1.008e+05 | 1.018e+05 | 1.024e+05 |
| P2 Validation | 1.002e+05 | 1.024e+05 | 1.034e+05 |
| P2 Reference | 1e+05 | 1.018e+05 | 1.033e+05 |
Availability — 7627 of 7631 positions complete (incomplete 2022-11-29T12:00 → 2022-11-30T06:00); nulls P1 196/1594879, P2 196/1594879

pressure_surface
Metadata
| Field | Value |
|---|---|
| units | Pa |
| long_name | Surface pressure |
| short_name | sp |
| standard_name | surface_air_pressure |
| step_type | instant |
Point time series — 2021-05-01T00:00 - 2026-07-21T12:00
| Point | min | mean | std | max |
|---|---|---|---|---|
| P1 | 9.318e+04 | 9.44e+04 | 616.8 | 9.555e+04 |
| P2 | 1.003e+05 | 1.017e+05 | 558.8 | 1.03e+05 |
Spatial — init=2024-01-15T00:00, lead=24h (reference at 2024-01-16T00:00)
| Source | min | mean | max |
|---|---|---|---|
| Validation | 4.835e+04 | 9.684e+04 | 1.067e+05 |
| Reference | 4.925e+04 | 9.683e+04 | 1.045e+05 |
Temporal — init=2025-08-17T12:00
| Source | min | mean | max |
|---|---|---|---|
| P1 Validation | 9.299e+04 | 9.434e+04 | 9.53e+04 |
| P1 Reference | 9.427e+04 | 9.514e+04 | 9.562e+04 |
| P2 Validation | 1.002e+05 | 1.024e+05 | 1.034e+05 |
| P2 Reference | 1e+05 | 1.018e+05 | 1.034e+05 |
Availability — 7627 of 7631 positions complete (incomplete 2022-11-29T12:00 → 2022-11-30T06:00); nulls P1 196/1594879, P2 196/1594879

relative_humidity_2m
Metadata
| Field | Value |
|---|---|
| units | percent |
| long_name | 2 metre relative humidity |
| short_name | 2r |
| standard_name | relative_humidity |
| step_type | instant |
Point time series — 2021-05-01T00:00 - 2026-07-21T12:00
| Point | min | mean | std | max |
|---|---|---|---|---|
| P1 | 21.54 | 63.19 | 17.32 | 95.89 |
| P2 | 58.32 | 70.53 | 8.323 | 88.74 |
Spatial — init=2024-01-15T00:00, lead=24h (reference at 2024-01-16T00:00)
| Source | min | mean | max |
|---|---|---|---|
| Validation | 3.406 | 80.08 | 100 |
| Reference | 4.094 | 80.29 | 100 |
Temporal — init=2025-08-17T12:00
| Source | min | mean | max |
|---|---|---|---|
| P1 Validation | 13.88 | 48.6 | 98 |
| P1 Reference | 20 | 57.42 | 94.5 |
| P2 Validation | 51.75 | 67.22 | 91 |
| P2 Reference | 53 | 68.98 | 88 |
Availability — 7627 of 7631 positions complete (incomplete 2022-11-29T12:00 → 2022-11-30T06:00); nulls P1 196/1594879, P2 196/1594879
temperature_2m
Metadata
| Field | Value |
|---|---|
| units | degree_Celsius |
| long_name | 2 metre temperature |
| short_name | 2t |
| standard_name | air_temperature |
| step_type | instant |
Point time series — 2021-05-01T00:00 - 2026-07-21T12:00
| Point | min | mean | std | max |
|---|---|---|---|---|
| P1 | -21.53 | 9.424 | 6.003 | 31.05 |
| P2 | 14.33 | 18.73 | 1.235 | 24.19 |
Spatial — init=2024-01-15T00:00, lead=24h (reference at 2024-01-16T00:00)
| Source | min | mean | max |
|---|---|---|---|
| Validation | -51.75 | 3.573 | 39.25 |
| Reference | -49.25 | 3.757 | 39 |
Temporal — init=2025-08-17T12:00
| Source | min | mean | max |
|---|---|---|---|
| P1 Validation | 9.188 | 25.79 | 40.25 |
| P1 Reference | 9.625 | 21.8 | 37.25 |
| P2 Validation | 13.31 | 15.68 | 18.75 |
| P2 Reference | 13.31 | 16.16 | 19 |
Availability — 7627 of 7631 positions complete (incomplete 2022-11-29T12:00 → 2022-11-30T06:00); nulls P1 196/1594879, P2 196/1594879
temperature_80m
Metadata
| Field | Value |
|---|---|
| units | degree_Celsius |
| long_name | 80 metre temperature |
| short_name | 80t |
| standard_name | air_temperature |
| step_type | instant |
Point time series — 2021-05-01T00:00 - 2026-07-21T12:00
| Point | min | mean | std | max |
|---|---|---|---|---|
| P1 | -20.99 | 9.512 | 5.68 | 30.9 |
| P2 | 13.13 | 17.77 | 1.429 | 23.28 |
Spatial — init=2024-01-15T00:00, lead=24h (reference not available)
| Source | min | mean | max |
|---|---|---|---|
| Validation | -46.5 | 3.783 | 37.25 |
Temporal — init=2025-08-17T12:00
| Source | min | mean | max |
|---|---|---|---|
| P1 Validation | 10.5 | 25.3 | 38.5 |
| P2 Validation | 12.12 | 14.8 | 19 |
Availability — 7627 of 7631 positions complete (incomplete 2022-11-29T12:00 → 2022-11-30T06:00); nulls P1 196/1594879, P2 196/1594879

total_cloud_cover_atmosphere
Metadata
| Field | Value |
|---|---|
| units | percent |
| long_name | Total cloud cover |
| short_name | tcc |
| standard_name | cloud_area_fraction |
| step_type | avg |
Point time series — 2021-05-01T00:00 - 2026-07-21T12:00
| Point | min | mean | std | max |
|---|---|---|---|---|
| P1 | 8.391 | 56.87 | 37.28 | 97.98 |
| P2 | 17.02 | 60.17 | 37.37 | 93.78 |
Spatial — init=2024-01-15T00:00, lead=24h (reference at 2024-01-16T00:00)
| Source | min | mean | max |
|---|---|---|---|
| Validation | 0 | 68.82 | 100 |
| Reference | 0 | 60.19 | 100 |
Temporal — init=2025-08-17T12:00
| Source | min | mean | max |
|---|---|---|---|
| P1 Validation | 0 | 29.1 | 100 |
| P1 Reference | 0 | 28.05 | 100 |
| P2 Validation | 0 | 51.8 | 100 |
| P2 Reference | 0 | 50.91 | 100 |
Availability — 7627 of 7631 positions complete (incomplete 2022-11-29T12:00 → 2022-11-30T06:00); nulls P1 196/1587248, P2 196/1587248

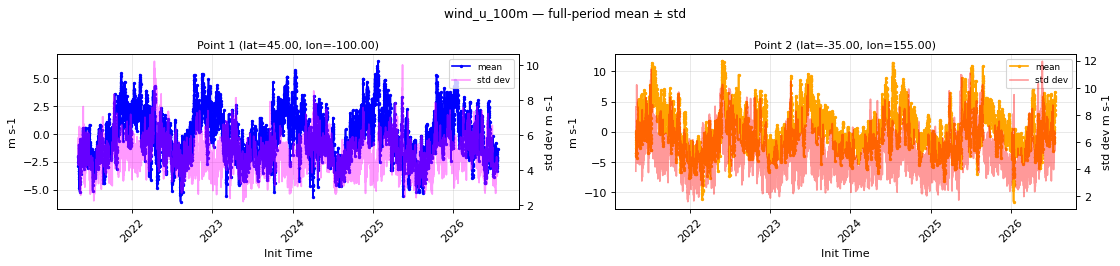
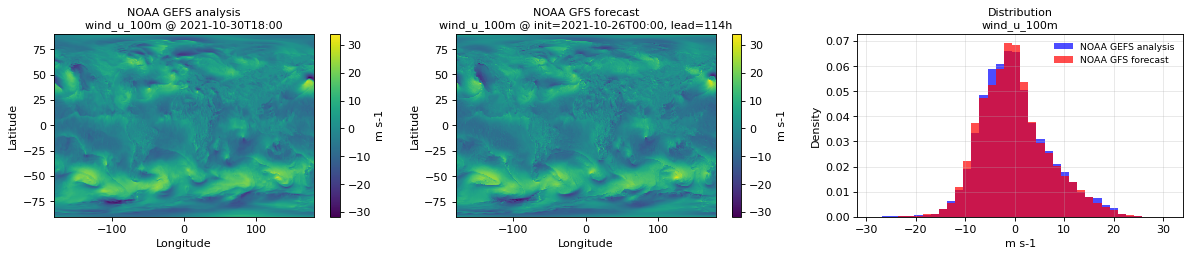
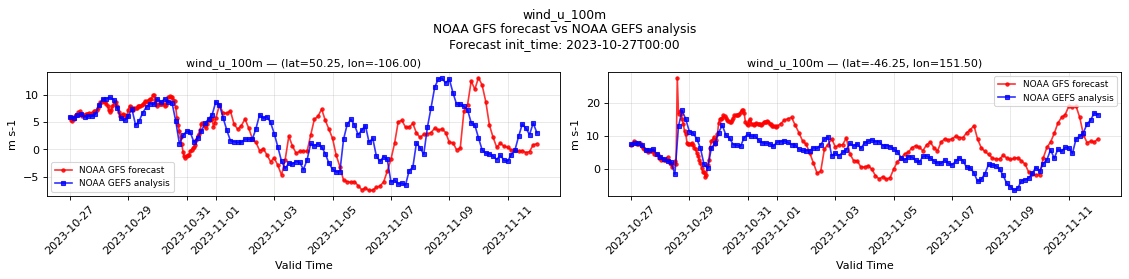
wind_u_100m
Metadata
| Field | Value |
|---|---|
| units | m s-1 |
| long_name | 100 metre U wind component |
| short_name | 100u |
| standard_name | eastward_wind |
| step_type | instant |
Point time series — 2021-05-01T00:00 - 2026-07-21T12:00
| Point | min | mean | std | max |
|---|---|---|---|---|
| P1 | -6.07 | -0.2217 | 4.888 | 6.483 |
| P2 | -11.56 | 0.2586 | 5.172 | 11.65 |
Spatial — init=2024-01-15T00:00, lead=24h (reference at 2024-01-16T00:00)
| Source | min | mean | max |
|---|---|---|---|
| Validation | -38 | -0.6251 | 32 |
| Reference | -28.75 | -0.6023 | 31.25 |
Temporal — init=2025-08-17T12:00
| Source | min | mean | max |
|---|---|---|---|
| P1 Validation | -10.25 | -1.33 | 19.25 |
| P1 Reference | -8.625 | -2.076 | 6.562 |
| P2 Validation | -10.38 | -1.123 | 17 |
| P2 Reference | -13.75 | 0.7813 | 19.25 |
Availability — 7627 of 7631 positions complete (incomplete 2022-11-29T12:00 → 2022-11-30T06:00); nulls P1 196/1594879, P2 196/1594879

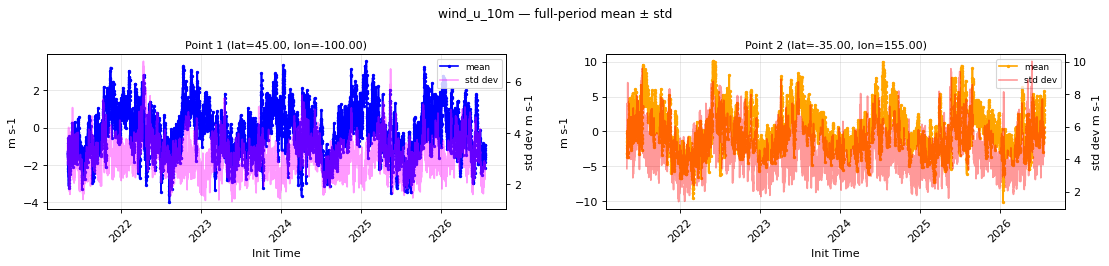
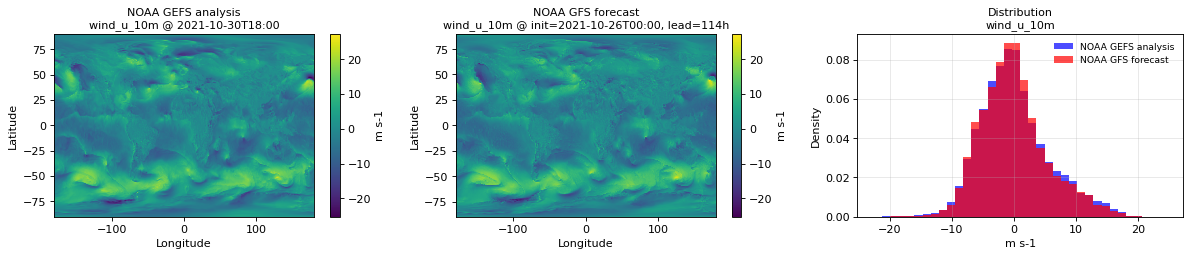
wind_u_10m
Metadata
| Field | Value |
|---|---|
| units | m s-1 |
| long_name | 10 metre U wind component |
| short_name | 10u |
| standard_name | eastward_wind |
| step_type | instant |
Point time series — 2021-05-01T00:00 - 2026-07-21T12:00
| Point | min | mean | std | max |
|---|---|---|---|---|
| P1 | -3.961 | -0.2652 | 3.081 | 3.554 |
| P2 | -10.06 | 0.113 | 4.508 | 10.05 |
Spatial — init=2024-01-15T00:00, lead=24h (reference at 2024-01-16T00:00)
| Source | min | mean | max |
|---|---|---|---|
| Validation | -29.75 | -0.4905 | 25.75 |
| Reference | -23.5 | -0.5188 | 26 |
Temporal — init=2025-08-17T12:00
| Source | min | mean | max |
|---|---|---|---|
| P1 Validation | -6.125 | -0.8714 | 12.62 |
| P1 Reference | -5.438 | -1.365 | 4.562 |
| P2 Validation | -9.125 | -1.083 | 14.12 |
| P2 Reference | -11.12 | 0.6306 | 16.75 |
Availability — 7627 of 7631 positions complete (incomplete 2022-11-29T12:00 → 2022-11-30T06:00); nulls P1 196/1594879, P2 196/1594879
wind_u_80m
Metadata
| Field | Value |
|---|---|
| units | m s-1 |
| long_name | 80 metre U wind component |
| short_name | 80u |
| standard_name | eastward_wind |
| step_type | instant |
Point time series — 2021-05-01T00:00 - 2026-07-21T12:00
| Point | min | mean | std | max |
|---|---|---|---|---|
| P1 | -5.871 | -0.2569 | 4.676 | 6.069 |
| P2 | -11.46 | 0.2366 | 5.123 | 11.54 |
Spatial — init=2024-01-15T00:00, lead=24h (reference not available)
| Source | min | mean | max |
|---|---|---|---|
| Validation | -37 | -0.6149 | 31.5 |
Temporal — init=2025-08-17T12:00
| Source | min | mean | max |
|---|---|---|---|
| P1 Validation | -9.75 | -1.288 | 18.5 |
| P2 Validation | -10.25 | -1.132 | 16.5 |
Availability — 7627 of 7631 positions complete (incomplete 2022-11-29T12:00 → 2022-11-30T06:00); nulls P1 196/1594879, P2 196/1594879

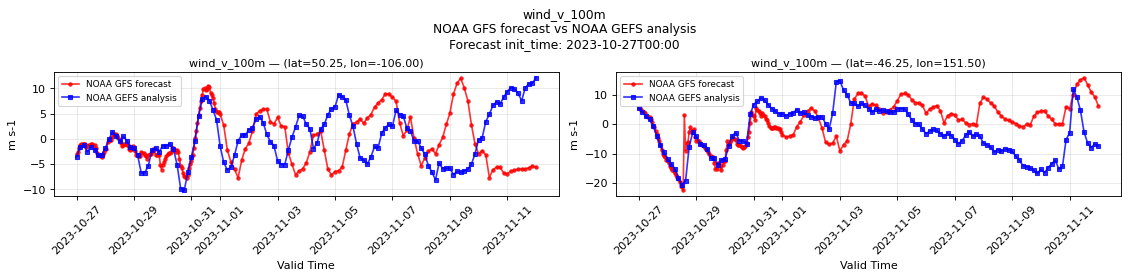
wind_v_100m
Metadata
| Field | Value |
|---|---|
| units | m s-1 |
| long_name | 100 metre V wind component |
| short_name | 100v |
| standard_name | northward_wind |
| step_type | instant |
Point time series — 2021-05-01T00:00 - 2026-07-21T12:00
| Point | min | mean | std | max |
|---|---|---|---|---|
| P1 | -6.424 | 0.03127 | 5.809 | 7.479 |
| P2 | -9.301 | 0.2014 | 7.181 | 11.3 |
Spatial — init=2024-01-15T00:00, lead=24h (reference at 2024-01-16T00:00)
| Source | min | mean | max |
|---|---|---|---|
| Validation | -38 | -0.5335 | 39 |
| Reference | -30.5 | -0.5339 | 27.75 |
Temporal — init=2025-08-17T12:00
| Source | min | mean | max |
|---|---|---|---|
| P1 Validation | -13.88 | 1.649 | 15.5 |
| P1 Reference | -10.12 | 0.5582 | 10.12 |
| P2 Validation | -20.5 | -0.07563 | 14 |
| P2 Reference | -19.25 | -1.76 | 20.5 |
Availability — 7627 of 7631 positions complete (incomplete 2022-11-29T12:00 → 2022-11-30T06:00); nulls P1 196/1594879, P2 196/1594879

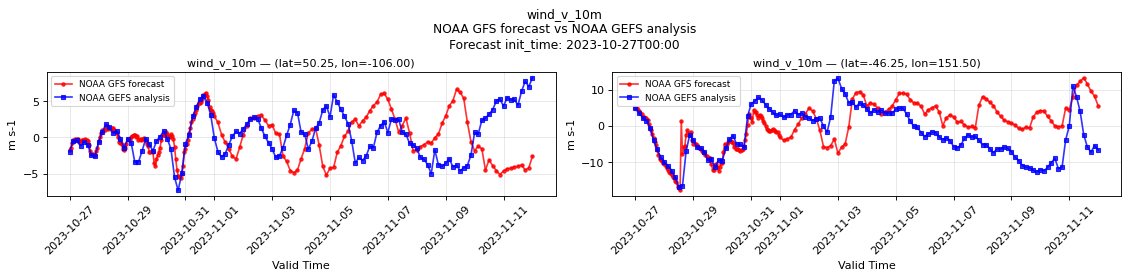
wind_v_10m
Metadata
| Field | Value |
|---|---|
| units | m s-1 |
| long_name | 10 metre V wind component |
| short_name | 10v |
| standard_name | northward_wind |
| step_type | instant |
Point time series — 2021-05-01T00:00 - 2026-07-21T12:00
| Point | min | mean | std | max |
|---|---|---|---|---|
| P1 | -3.999 | -0.04914 | 3.542 | 4.606 |
| P2 | -7.324 | 0.3473 | 6.206 | 9.66 |
Spatial — init=2024-01-15T00:00, lead=24h (reference at 2024-01-16T00:00)
| Source | min | mean | max |
|---|---|---|---|
| Validation | -31 | -0.4572 | 33 |
| Reference | -24.25 | -0.455 | 21.75 |
Temporal — init=2025-08-17T12:00
| Source | min | mean | max |
|---|---|---|---|
| P1 Validation | -9 | 0.9506 | 9.75 |
| P1 Reference | -7.438 | 0.1733 | 5.75 |
| P2 Validation | -16.25 | 0.1947 | 12.25 |
| P2 Reference | -15.75 | -1.357 | 17.5 |
Availability — 7627 of 7631 positions complete (incomplete 2022-11-29T12:00 → 2022-11-30T06:00); nulls P1 196/1594879, P2 196/1594879
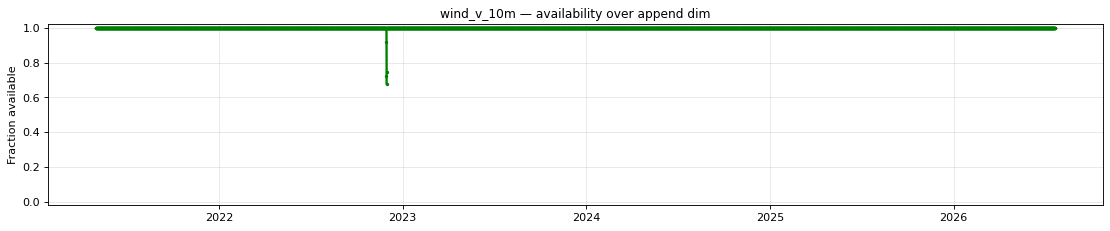
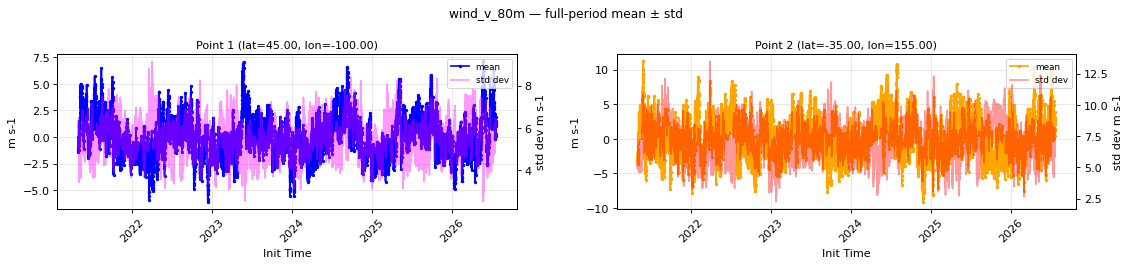
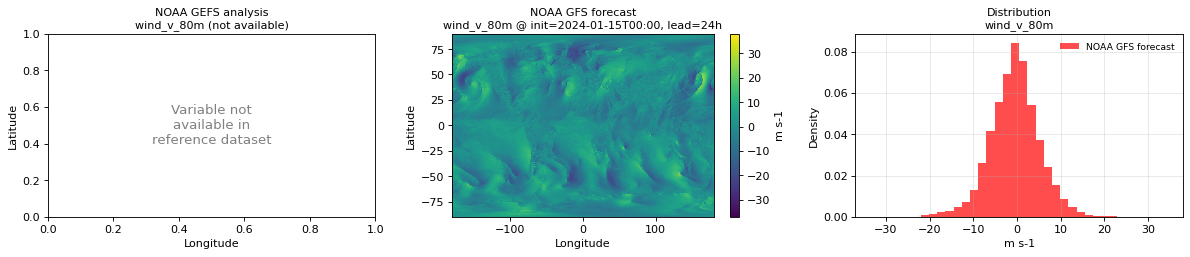
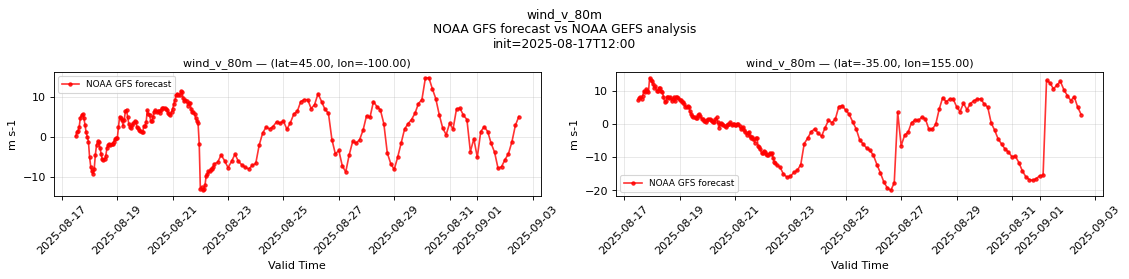
wind_v_80m
Metadata
| Field | Value |
|---|---|
| units | m s-1 |
| long_name | 80 metre V wind component |
| short_name | 80v |
| standard_name | northward_wind |
| step_type | instant |
Point time series — 2021-05-01T00:00 - 2026-07-21T12:00
| Point | min | mean | std | max |
|---|---|---|---|---|
| P1 | -6.068 | 0.01752 | 5.52 | 7.124 |
| P2 | -9.068 | 0.2272 | 7.104 | 11.19 |
Spatial — init=2024-01-15T00:00, lead=24h (reference not available)
| Source | min | mean | max |
|---|---|---|---|
| Validation | -37 | -0.5305 | 38 |
Temporal — init=2025-08-17T12:00
| Source | min | mean | max |
|---|---|---|---|
| P1 Validation | -13.38 | 1.554 | 14.88 |
| P2 Validation | -20 | -0.03854 | 13.88 |
Availability — 7627 of 7631 positions complete (incomplete 2022-11-29T12:00 → 2022-11-30T06:00); nulls P1 196/1594879, P2 196/1594879